Introduction
Expectations regarding future inflation play an important role in the pricing policy of enterprises and in wage negotiations. Also for a monetary policy that is geared towards maintaining a low and stable level of inflation, an assessment of the expected inflation is of crucial importance as it provides important information about the effectiveness of monetary policy and the credibility of the central bank.
Inflation expectations cannot be observed directly, they have to be derived either from the prices of inflation-indexed financial market instruments or from survey data. In the case of emerging economies, the second option is usually preferred due to the still low development level of financial markets.
There exists a great variety of surveys concerning the expectations of various economic agents regarding the future developments of prices, production, employment etc. One well-survey is the European Commission (EC) Consumer Survey, conducted on a monthly basis and containing questions about the financial and general economic situation, price developments and unemployment. The principle of harmonisation underlying the Commission’s survey programme produces a set of comparable data for all Member States. Regarding the price expectations, two questions are of interest: one question asks how prices are perceived now compared to 12 months ago and the other aims to find out what the survey participants expect of the future price development. So the data from this survey are qualitative in nature, providing a direction of change and not an exact value, and need to be quantified for further analysis.
The focus of this paper is to present different quantification methods of expected inflation on the basis of survey data and to apply these techniques to determine and compare inflation expectations for Romania, Czech Republic, Poland and Hungary using data from EC Consumer Survey. These countries are new European Union member states from Central and Eastern Europe with an explicit inflation targeting monetary policy regime, so inflation expectations and, in particular, how they change over time is of crucial importance for the policymakers.
The paper is related to the contributions of Nardo (2003) and Åyziak (2010). Both papers offer a critical review of the different quantification methods, highlighting the limits of their use in macroeconomic modelling. However, Nardo (2003) approach is only theoretical; in contrast, as mentioned, this paper also presents consumer inflation expectations derived on the basis of qualitative data from the EC Consumer Survey for Romania, Czech Republic, Poland and Hungary. Moreover, departing from Åyziak (2010), it also provides a comparison between the four countries mentioned with respect to perceived and expected inflation.
The remainder of the paper is organized as follows: section 2 gives an overview of the data, section 3 describes the methodologies used for converting qualitative survey data into quantitative measures of agents’ expectations, while section 4 presents the results. Finally, section 5 concludes.
Data
The Directorate General for Economic and Financial Affairs (DG ECFIN) conducts regular harmonised surveys for different sectors of the economies in the European Union and in the applicant countries. They are addressed to representatives of the industry (manufacturing), services, retail trade and construction sectors, as well as to consumers. Based on the detailed results of the Harmonised Programme, the Commission calculates and publishes a set of monthly composite indicators.
Question number 5 and 6 from the Consumer Survey, which deals with the perceived and the expected inflation respectively, are of interest for the analysis conducted here. Table 1 shows the exact wording of both questions and the possible answers for the respondents:
Table 1: Questions 5 and 6 from the EC Consumer Survey

The countries considered in the analysis are Romania, Czech Republic, Poland and Hungary. These are all new European Union member states with an explicit inflation targeting monetary policy regime. The time span is May 2001-February 2016 for Romania and Poland, January 2001-February 2016 for Czech Republic and February 1993-February 2016 for Hungary (the complete set of available observations for each country).
Figures 1 and 2 illustrate the data, i.e. the weights corresponding to the possible answers for each of the two questions extracted from the survey. It is obvious that for the analysed period most of the respondents perceived/expected an increase in prices, although the percentages corresponding to these categories have decreased significantly in the last two years as a result of the low inflation environment
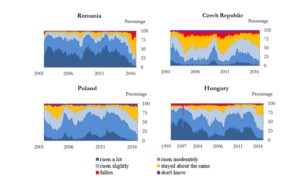
Figure 1: The corresponding weights for each possible answer to question 5 from the EC Consumer Survey
Source: EC Consumer Survey
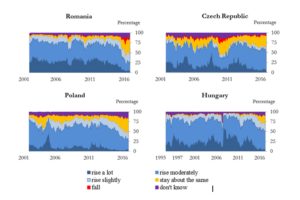
Figure 2: The corresponding weights for each possible answer to question 6 from the
EC Consumer Survey
Quantification techniques of consumer inflation expectations on the basis of survey data
The methods proposed in the literature for converting qualitative survey data into quantitative measures of agents’ expectations are essentially three: the balance statistic used by Eurostat, the Carlson-Parkin method and the Pesaran’s regression approach.
Balance statistics
Balance statistics offer the easiest way to summarize the responses to survey questions. They are constructed as the difference between the percentages of respondents giving positive and negative replies.
An example of a balance statistic is the one currently used by the European Commission when building composite indicators:

where and represent the fractions of respondents perceiving/expecting increases in prices of different magnitudes, represents the fraction of respondents not
perceiving/expecting a movement in prices and represents the fraction of respondents perceiving/expecting a decrease in prices (see Table 1).
Although balance statistics provide a useful and synthetic measure of the opinions expressed in a survey, they do not measure expected or perceived inflation directly, being possible that the same distribution of responses to the survey questions to reflect significantly different values of expected/perceived inflation in economies or time periods characterized by high or low inflation (Åyziak (2010)). Also, as shown in Åyziak (2003), an improvement in opinions regarding future price movements, as disclosed by balance statistics, does not necessarily mean that inflation expectations have been reduced but, instead, a higher perceived rate of inflation and, implicitly, higher inflation expectations.
The next two quantification methods were developed in order to overcome these limitations and to obtain numerical measures of perceived and expected inflation.
Probability Method
The probability method was first employed by Theil (1952) but it was the seminal paper of Carlson and Parkin (1975) that made it popular. It was originally developed to survey questions with three response categories — the so called trichotomous survey. As in this study the questions of interest have more than three possible answers (see Table 1), the extended version of the probability method due to Batchelor and Orr (1988), that deals with the pentachotomous case, is considered. The number of respondents that have chosen the “don’t know” option is distributed proportionally between the other response categories as this category is not relevant for quantification.
In the probability method, it is assumed that respondents answer survey questions using the median of their own subjective distribution of future inflation, , where represents the time t expected future percentage price change of agent i for the next 12 months and the information set at time t. The distribution is segmented by indifference intervals which are considered to be symmetric and equal for all agents: respondents are supposed to report at time t an increase/decrease in the price level if the expected future inflation rate is at least units above/below 0; moreover, they will report a more/less rapid increase in the price level if the expected rate of inflation is at least units above/below the perceived inflation for the last 12 months, (Figure 3).
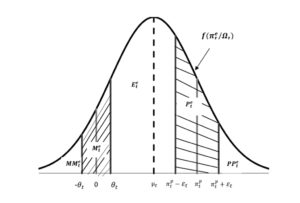
Figure 3: Quantification of pentachotomous survey data for a normal distribution function
If the individual distributions have the same form, are independent across agents and, furthermore, have finite first and second moments, the survey results can be interpreted as a sampling from the joint probability distribution with mean , i.e. the expected price change at time t, and variance . In this case, the share of respondents replying to each category can be viewed as maximum likelihood estimates of areas under the density function of aggregate inflation expectations:
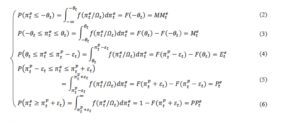
where represents the cumulative distribution function of .
Using a standardized variable, the system above can be written as:
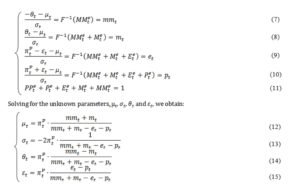
The parameters depend on the choice of the distribution function (in order to determine pt,et ,mt and mmt respectively), as well as on the perceived inflation rate , that has a scaling role for the expected inflation rate.
There is no consensus in the literature regarding the actual distribution of expectations, a number of alternatives to normal distribution being considered: the uniform distribution (e.g. Lyziak (2003)), the logistic distribution (e.g. Batchelor and Orr (1988), Nielsen (2003)), the central and non-central t distributions (e.g. Nielsen (2003), Jelea (2013)) and the triangular distribution (e.g. Lyziak (2003)). Without access to individual responses to the survey it is impossible to check the accuracy of the different possible distribution assumptions. However, there is evidence in the literature that the chosen distribution makes little difference to the derived expectation series (Nielsen (2003), Batchelor (2006)). In this study, the assumption of normality of the underlying aggregate distribution function is chosen. For this specific case, represents the cumulative standard normal distribution function.
As far as the scaling parameter is concerned, there are primary two proxies used in the literature: the most recent official inflation rate available to the survey participants and the measure derived on the basis of the survey question concerning past prices. The first proxy implies the rather strict hypothesis that the respondents perceive correctly the officially published inflation rate, so the second method is preferred. The same methodology as the one described above is applied to question number 5, the role of the scaling parameter being replaced by a measure of the moderate rate of inflation which represents the consumers’ best guess of the permanent or trend rate of inflation (Batchelor and Orr (1988)). In order to determine the moderate rate of inflation, the Hodrick-Prescott filter is applied to the actual inflation rate for each of the four countries considered in the analysis.
The main drawbacks of the probability method concern the fact that it imposes a causal relationship between the current inflation and expected inflation and that the quantified measure is a function of a specific distribution function, although, as mentioned, the chosen distribution seems to make little difference for the derived expectation series. Furthermore, if the distribution is defined over the method breaks down if one of the extreme responses of the survey question is chosen by none of the respondents, as, if the value of the aggregate distribution function is zero, the value of the inverse of the normal distribution function approaches minus infinity. This was the case in some periods of the analysed samples, when none of the respondents perceived/expected a decline in prices. The approach used was the one presented in Sabrowski (2008), more exactly was added to the response category that equaled zero, where n represents the number of available observations.
Regression Approach
As an alternative to Carlson-Parking method, Pesaran (1984, 1987) developed the regression approach, along the lines suggested by Anderson (1952). This method is based on the assumption that the estimated relationship between current inflation (as measured by official statistics) and its survey perception by respondents holds also between expected inflation and qualitative opinions of respondents concerning future price changes. Thus, in contradiction to probability method, quantitative expectations determined using the regression method are a function of a specific regression model, rather than a function of a specific probability distribution.
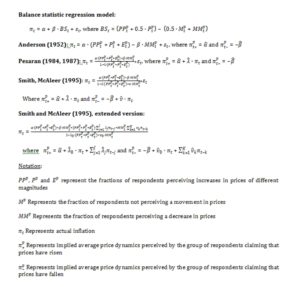
There are several models that can be employed in order to approximate the relationship between inflation and the survey data. This paper tests four of them, in line with the study of Åyziak (2010): a simple model based on the balance statistic determined by the European Commission, as well as the models proposed by Anderson (1952), Pesaran (1984, 1987) and Smith and McAleer (1995). Annex I provides a complete description of the models employed.
Each model can be summarized by the following equation:

where the estimated coefficients represent implied average price dynamics perceived by the group of respondents claiming that prices have risen () and the group of respondents declaring that prices have fallen (). The structure of the equation, with the official inflation used as the dependent variable and the survey responses as independent ones, imposes unbiasedness of inflation perceptions. Cunningham (1997) argues that in order to obtain unbiased and efficient estimates of the relationship between the survey and official data, the survey data should be the dependent variable because it may contain measurement errors, while it is assumed that the official data are not subject to revision. However, in practice, the differences between this approach and the one suggested by Smith and McAleer (1995) are very small.
According to regression method, the expression above holds not only for realizations, but also for expectations:

It is not mandatory to have a linear relationship between the official inflation and the survey responses as this depends on the way and are defined. As pointed out by Nardo (2003), in case of a non-linear relationship between the official inflation and the survey responses – Pesaran’s model (1984, 1987), Smith and McAleer model (1995) – equation (17) represents only a first approximation of , conditional upon qualitative information. Finding from a non-linear equation involves also the knowledge of means and variances of qualitative information which is not possible since the individual responses to the survey are not available.
There are several drawbacks to regression approach too. A first one questions the key assumption of the method: there is no clear evidence that people judge the past in the same way as they formulate expectations about the future. Moreover the method is not well suited to work with polychotomous survey, requiring an aggregation of three fractions of respondents perceiving or expecting increases of different magnitudes in prices, this being equivalent to a loss of information. Also it imposes unbiasedness of inflation perceptions, a causal relationship between the current inflation and expected inflation and it does not offer a unique solution for the values of inflation expectations as the reestimation of regression models (for example in order to incorporate new releases of data) leads to different values for the estimated coefficients.
Results
This section presents the results obtained by applying the methodologies described above to the Consumer Survey data for Romania, Czech Republic, Poland and Hungary.
Balance statistics
Figure 4 shows monthly data for annual CPI inflation as well as the balance statistics of consumers’ opinions on perceived and expected inflation determined as presented in equation (1). The balance statistic of expected inflation has been shifted forward 12 months, i.e. the actual inflation and the balance statistic of perceived inflation are compared with the expectation for the current period that has been formed 12 months before.
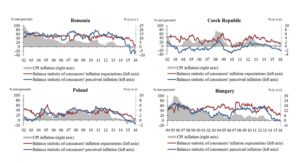
Figure 4: Balance statistics of perceived and expected inflation
Source: EC, INS, CZO, NBP and MNB data
To compare the balance statistics of expected/perceived inflation with the actual inflation, the method suggested in Åyziak (2013) is used, i.e. the official CPI inflation is translated into a qualitative measure as follows:

The results are presented in Table 2. The average price dynamics expected/perceived as compared to the average of actual inflation suggest that the Polish and Czech consumers form their opinion in an optimistic manner, while Romanian and Hungarian consumers in a pessimistic one. Considering average balance statistics for the period May 2002 — February 2016, for which observations from the survey are available for all the four countries analysed, the consumers in Czech Republic seem to be the most optimistic in terms of perceived changes in price level, while Romanians are the most pessimistic. The Czech and Polish consumers reveal the highest degree of optimism when assessing future price changes, while Hungarian consumers the lowest one, followed by Romanian.
Table 2: Average balance statistics of inflation expectations/perceptions and actual inflation

In order to compare the consumer capacity to correctly detect the current/future movement in prices, the correlation coefficients between the balance statistics of perceived/expected inflation and the current CPI inflation have been determined. The results are shown in Table 3. The consumers from Poland have the highest correlation between the balance statistic of perceived inflation and the current inflation, while the ones from Czech Republic the lowest ones. All the countries present a low degree of correlation between the balance statistic of expected inflation and the current inflation. In Romania, the consumers’ expectations regarding future inflation follow developments of perceived inflation closely (correlation coefficient of 88% between the two balance statistics): in periods of perceived rising/declining inflation, consumers’ opinion on expected price changes tends to worsen/improve.
Table 3: Correlation coefficients, common sample (May 2002 — February 2016)

Quantification methods for obtaining numerical measures of perceived and expected inflation
As mentioned, in case of the probability method the assumption of normality of the underlying aggregate distribution function is employed. As far as the moderate rate of inflation is concerned, the Hodrick-Prescott filter is applied to the actual inflation rate for each of the four countries considered in the analysis.
Regarding the regression approach, the final version of the estimated equation for each of the economies (Table 4) was selected on the basis of a comparison of statistical properties, but also taking into consideration the economic interpretation of the estimated coefficients (e.g. correct signs in accordance with economic theory). For all the four countries considered in the analysis, an extended version of the model proposed by Smith and McAleer (1995) was preferred.
Table 4: Selected regression models
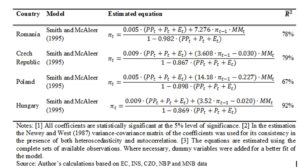
The series of expected inflation, determined by applying the two methodologies, and the actually inflation, are represented in Figure 5. As the expected inflation concerns the next 12 months, the actual inflation is compared with the expectations that have been formed 12 months ago.
Summarizing the results, a couple of points could be made. Firstly, the two proxies of consumers’ inflation expectations follow similar tendencies, the only exceptions being the pre-inflation targeting monetary policy regime periods in Romania and Hungary, characterised by a disinflation process. Secondly, expected inflation lags behind the actual inflation, which may have two possible explanations: the expectations are formed in an adaptive manner or the survey participants consider a shorter time span than the twelve months period when answering the questionnaire (Nielsen (2003)). Thirdly, the series of inflation expectations obtained by applying the regression method are more volatile than the ones obtained using the probability method.
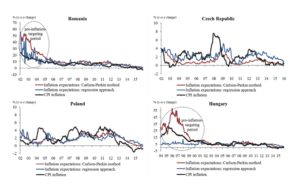
Figure 5: Expected inflation and actual annual inflation
Source: Author’s calculation based on EC, INS, CZO, NBP and MNB data
The averages of inflation expectations and of actual inflation respectively are reported for the complete sample of available information and for the inflation targeting period (Table 5): from the four countries analysed, Romania was the last one to adopt the inflation targeting (IT) monetary policy regime in August 2005; Czech Republic adopted it in January 1998, Poland in January 1999 and Hungary in June 2001. The results obtained when analysing the balance statistics of expected/perceived inflation are confirmed: the Polish and Czech consumers form their opinion in an optimistic manner, usually underestimating the actual inflation (in the case of Czech consumers the quantification of inflation expectations using the regression approach suggest an overestimation of the actual inflation in the analysed period), while Romanian and Hungarian consumers are more pessimistic, overestimating the actual inflation.
Table 5: Averages of inflation expectations and actual annual inflation

Conclusions
Inflation expectations influence the time path of the economy due to their often substantial impact in the process of agents’ decision making. Qualitative survey data that assess the economic agents’ expectations regarding future price developments are available. However, for modelling and forecasting purposes the data need to be numerically quantified.
This paper attempts to provide an overview of the different techniques used to convert qualitative assessments into quantitative data, i.e. the balance statistic, the Carlson-Parkin method and the Pesaran’s regression approach.
The balance statistic indicator, as calculated by the EC, is used to compare inflation perceptions and expectations in four Central and Eastern European countries, i.e. Romania, Czech Republic, Poland and Hungary. Probability and regression methods are used in order to provide numerical estimates of the expectations for the aforementioned countries. The results show an underestimation of actual inflation by the Polish and Czech consumers, while Romanian and Hungarian consumers seem to be more pessimistic, overestimating the actual inflation in a systematic manner.
References
- Anderson, O. Jr. (1952), “The business test of the IFO-Institute for economic research, Munich, and its theoretical model”, Revue de l’Institut International de Statistique, 20, 1-17.
Publisher – Google Scholar
- Batchelor, R.A. and Orr, A.B. (1988), “Inflation Expectations Revisited”, Economica, 55 (219), 317-331.
Publisher – Google Scholar
- Batchelor, R. (2006), “How robust are quantified survey data? Evidence from the United States”, NBP Workshop 2006: “The role of inflation expectations in modelling and monetary policy making”, National Bank of Poland.
Google Scholar
- Carlson, J.A., Parkin, M. (1975), “Inflation expectations”. Economica, 42, 123-138.
Publisher – Google scholar
- Cunningham, A. (1997), “Quantifying survey data”, Quarterly Bulletin: August 1997, Bank of England, 292-300.
- Jelea, A. (2013), “Modelarea anticipărilor inflaționiste. Aspecte empirice pentru România”, ABC-ul Lumii Financiare, 1, 409-431.
- Åyziak, T. (2003), “Consumer inflation expectations in Poland”, ECB Working Papers, 287, European Central Bank.
Google scholar
- Åyziak, T. (2010a), “Measurement of perceived and expected inflation on the basis of consumer survey data”, IFC Working Papers, 5, Bank for International Settlements.
- Nardo, M. (2003), “The quantification of qualitative survey data: A critical assessment”, Journal of Economic Surveys, 17 (5), 645-668.
Publisher – Google scholar
- Nielsen, A. (2003a), “Inflation expectations in the EU — Results from survey data”, Discussion Paper, 13/203, Humboldt University of Berlin.
- Pesaran, M.H. (1984), “Expectations formations and macroeconomic modeling”, Contemporary macroeconomic modeling, P. Malgrange and P.A. Muet (eds.), Basil Blackwell, Oxford, 207-244.
- Pesaran, M. H. (1987), “The limits to rational expectations”, Basil Blackwell, Oxford.
Google scholar
- Sabrowski, H. (2008), “Inflation expectation formation of German consumers: rational or adaptive?”, Working Paper Series in Economics, 1000, University of Lüneburg.
- Smith, J. and McAleer, M. (1995), “Alternative procedures for converting qualitative response data to quantitative expectations: an application to Australian manufacturing”, Journal of Applied Econometrics, 10, 165-185.
Publisher – Google scholar
- Theil, H. (1952), “On the shape of economic microvariables and the Munich business test”, Révue de l’Institut International de Statistique, 20, 105-120.
ANNEX I: Regression Models
