Introduction
The consideration paid on studying the impact of liquidity management on financial performance has increased both in the literature and the business environment. This is a concept linked with financial stability. Before the crisis from the previous years, financial stability was considered a matter of macroeconomics, assessed at country level or as a link between markets. However, at the present, companies also approach the financial stability issue.
In Romania, the effects of the financial crisis have manifested with a certain time lag compared to its onset on the international markets. This happened because of the fact that Romanian banks did not have in their portfolio the credit instruments that have caused problems in the international financial markets. The effects have been felt further through the impact on banks’ liquidity and the real economy. As a result of the general uncertainty regarding the economic evolution, banks adopted measures to tighten the lending conditions. These actions have seriously affected small firms, that have encountered difficulties to cover the current payments. Thus, many firms have faced the inability to meet the short-term financial obligations such as bankers and suppliers. According to the National Bank Financial Stability Report (2011), the average of SMEs receivable collection period has increased from 89 to 117 days, comparing December 2008 to December 2010. The problem was not restricted to SMEs. It is common knowledge that the economy is dependent on SMEs and that the large companies’ activity depends on them, including the listed companies. The same report shows that at national level, the average collection period of corporate accounts receivable has increased with 18%, considering that the default values were lower than in the rest of the economy.
It is also worth mentioning that if until a few years ago it was thought that there is a strong positive relationship between the economic growth and the financial development (Bumann et al, 2013), the recent studies (Laeven and Valencia, 2012) have showed that the consequences caused by the banking sector shock are higher in developed economies. Therefore, we can say that the situation from previous years has questioned theories such as Miller-Modigliani (1958, 1963), and showed that excessive indebtedness involves major risks affecting both liquidity and corporate results.
We believe that the impact of firm-level liquidity on performance has become a factor of concern, especially since this subject has not been extensively researched in emerging economies, such as the Romanian case.
The next section of this paper was dedicated to present a literature review regarding the impact of liquidity measured by liquidity rates. It has also been observed the influence of capital structure on the companies financial performance. The third part of the study shall contain the presentation of econometric equations tested by multivariate regression with panel data and the results obtained. The last part has been dedicated to conclusions and future research directions.
Literature Review
In the context of a turbulent economic environment and the impact caused by markets globalization, the analysis of corporate financial performance acquired new meanings. Ozkan and Ozkan (2004) argue that macroeconomic stability gives managers the opportunity to make better predictions about future cash flows. Baum et al (2006) observed that the small firms, those with high investment opportunities, the unlisted companies and firms that had faced cash flow volatility tend to maintain a higher level of liquidity. According to the authors, this fact could be explained by the higher level of asymmetric information these companies are confronting. Therefore, they will maintain a high level of liquidity to meet the unexpected financial difficulties. In this case, the main concern is the company’s ability to pay its short-term obligations.
We can say that liquidity is essential for obtaining financial performance, maintaining and improving the market position. Several studies led to this conclusion (Smith, 1980; Jose et al, 1996; Baños-Caballero et al, 2012). Summarizing, we could say that, on the one hand liquidity is a key element for the cost of capital, and on the other hand it is a measure of the risk that a company assumed. However, many doubts raise from the ambiguity of liquidity indicators and the issues they can hide, by creating a false sense of security. For example, a high level of liquidity can suggest a lower risk of the firm’s current debt coverage, but also can mean an inadequate use of the current assets. A critical value of liquidity indicators may indicate a risky situation or may be a groundless fear in the case of a company that could easily get external financing. However, the calculation of these indicators can be confusing.
Among the variables used to measure liquidity we can find: receivable conversion period, inventory conversion period (Deloof, 2003; Lazaridis and Tryfonidis, 2006), cash conversion period (Baños-Caballero et al, 2012), current ratio (Eljelly, 2004).
Associated with liquidity, capital structure was also defined and debated by numerous authors. These studies tried to examine whether capital structure affects profitability and has visible effects on the profits earned by a company. Obtaining the necessary resources and investing them in order to maximize profit or shareholder value is the main function of financial management. The indebtedness implications on performance were based on Modigliani and Miller (1963) theory. They demonstrated that the company value increases with the level of debt, as a result of tax savings acquired (considering that the results provide remuneration for all the stakeholders). On the other hand, debt increasing above a certain level is associated with simultaneous risk increasing. Afterwards, the pecking order theory was developed, supported for the first time by Donaldson (1961), and subsequently synthesized by Myers (1984). According to this theory, firms prefer primarily domestic financing sources and then the indebtedness.
There are also studies that showed that capital structure depends on country characteristic features (Borio, 1990; Rajan and Zingales, 1995), arguing that some economies are mostly oriented towards the banking financing, while others are mainly heading for the capital market. Chakraborty (2010) noted that capital structure also depends on economic development level.
Methodology
Research framework about the Romanian economy and capital market
The Romanian capital market is characterized by low liquidity level. A small number of listed companies hold a high percentage of the entire value of transactions of BSE. However, we can not argue that the Romanian capital market is not effective.
In Figure 1 we can see that, although in 2007 it was believed that the financial crisis will not affect Romania or that its impact will be minimal, we can observe a sharp change in terms of liquidity of the listed companies. This can be interpreted as a blockage of the Romanian companies to invest in a period during which the rumors on the international financial markets were negative. Therefore, the reaction was not syllogized and anticipative, but rather an emotional one, a fact wich is characteristic for unexperienced investors. Also, the capital market in Romania was characterized by lack of interest in controlling investment, a lack of interest in using the available resources and by mental state demarcation between economic developments and the investment evolution on financial markets. It is worth mentioning that these features are not specific to emerging markets, such as the Romanian case, but rather developed markets, thus partially explaining the causes of the financial crisis.
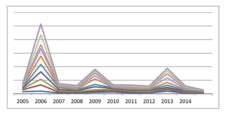
Figure 1: The trend line of current liquidity ratio of BSE listed companies
Source: Own processing using Excel
At the same time, the indebtedness of Romanian companies has oscillated. From a relatively stable level in 2007 and 2008, in Figure 2 we can see a sharp decline in 2009. This can be considered the time of maximum impact of the financial crisis in Romania. We believe that the indebtedness upward trend in the next years will generate negative effects on performance if it is not correlated with a policy of productive investments in fixed and commercial assets or intangible assets.
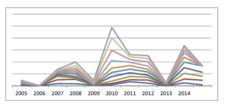
Figure 2: The trend line of leverage of BSE listed companies
Source: Own processing using Excel
We can see that an indirect effect of the financial crisis has been bringing back the discussion about the impact of taxation in companies activity and profitability, aiming to tackle the negative effects of the tax burden. Thereby, we also introduced in this analysis the effective tax rate variable.
In Romania, starting from 1 January 2005, the flat tax of 16% is applied. On Figure 3, we can see near linear developments regarding the fiscal pressure after that year. However, changes arise in 2009-2010. This period marks the introduction of the compulsory minimum tax since May 2009 and its waiving in October 2010. Although the assumptions were that this will particularly affect the small firms, we can se that the impact has also been felt by the listed companies.
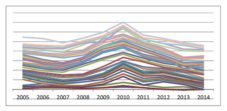
Figure 3: The trend line of effective tax rate in Romania, within 2005-2014
Source: Own processing using Excel
Data
For this study, the sample we used was selected from companies listed on the Bucharest Stock Exchange. From the beginning banks, financial investment companies and companies that recorded negative equity were excluded. In the end, fifty companies were retained for this analysis. They come from all branches of industry. Data were taken from Thomson Reuters Eikon database, for the 2005-2014 period.
Table 1: presents the variables used in the empirical research
Source: Own processing
The test of variables was performed by following multivariate regression models:
Firm_performancei,t = α0 + α1*L1i,t + α2*L2i,t + α3*LEV1i,t + α4*LEV2i,t + α5*WKSi,t + α6*CCi,t + α7*ETRi,t + εi,t (1)
Where: Firm_performance = ROA, ROE;
α0 = the constant;
α1, …, α7 = the slope parameters;
εj = error term, quantifying the influence of factors with random action;
t = 2009,…,2015;
i = 1, 2,…,50.
Before testing the models, the correlation matrix was conducted in order to examine the relationship between variables. We did not notice the presence of high correlations between the dependent and independent variables. Therefore, they will be used in the established econometric model.
Table 2: Correlation matrix of the variables used in the research
Source: Own processing
Table 3 presents a summary of the descriptive statistics of the dependent and independent variables used in research. We can see that the variables follow leptokurtic distribution. The positive skewness of the performance variables marks higher frequency of lower returns than the average.
Table 3: Descriptive statistics
Source: Own processing
Results
In the next part, a summary of the results obtained by processing data in Eviews is presented.
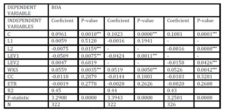
In the first model, return on assets was used as a dependent variable. In terms of liquidity, we can se that only current ratio (L2) influences performance. The correlation being negative, a decline of the liquidity ratio will lead to an increase of return on assets. A lessening of liquidity is not perceived as a risk factor, but rather it is considered as a more effective use of resources that will lead to improved performance.
Table 4: Results of panel data regression analysis, using ROA as dependent variable
Source: Own processing using Eviews, p-value ***<1%, **<5%, *<10%.
We can say that the panic caused by financial shocks has led companies to maintain a high level of liquidity, thus losing investment opportunities. Regarding indebtedness, the results showed that a lower leverage (LEV1) will lead to an improvement of performance. We also note that an increase of working capital / change of sales ratio will lead to an improvement of financial performance. This indicator quantifies how well a company uses the working capital in order to support a certain level of turnover and it is simultaneously an indicator of operational liquidity. This shows the level that a company can sustain the short-term debts using only cash flow from sales, without resorting to external sources.
Contrary to the presumption with which we started, the correlation between return on assets and the effective tax rate was not statistically validated. The explanation may be driven by the stability of statutory tax rate in the studied period, excepting the year 2009.
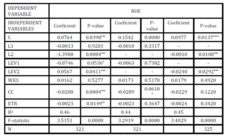
Table 5: Results of panel data regression analysis, using ROE as dependent variable
Source: Own processing using Eviews, p-value ***<1%, **<5%, *<10%.
Similar results were obtained related to return on equity. It is worth mentioning that in relation with financial leverage, the relationship is negative. Romanian companies are using particularly the bank financing and an increase of leverage is associated with a higher risk, including the risk of bankruptcy.
On the other hand, as we could foresee, a prolongation of the period to convert investments into cash has a negative impact on performance. This is associated with blocking the company’s liquid funds in inventories and with the sales efficiency deterioration. In this regard, it should be noted the Romanian companies tendency to use operating debt as a source for financing their current activity.
Conclusions
This work aimed to identify the relationship between liquidity and corporate financial performance. The results showed that a decrease of liquidity level is not perceived as a risk factor for the Romanian companies. The study covered the period before and after the financial crisis and confirmed a statistically significant relationship. For further analysis, we intend to study if there is a gap in tracking the effects generated by these variables on financial performance.
References
1. Baños-Caballero, S., GarcÄa-Teruel P.J. and MartÄnez-Solano P. J. (2012), ´How does working capital management affect the profitability of Spanish SMEs?´, Small Business Economics, 39, 517-529.
Publisher – Google Scholar
2. Baum C. F., Caglayan M., Ozkan N. and Talavera O. (2006), ´The impact of macroeconomic uncertainty on non-financial firms’ demand for liquidity´, Review of Financial Economics, 15, 289 — 304.
Publisher – Google Scholar
3. Borio, C. (1990), ´Leverage and financing of non-financial companies: An international perspective´, BIS Economic Papers, 27, 1-82.
Google Scholar
4. Bumann, S., Hermes, N. and Lensink, R. (2013), ´Financial liberalization and economic growth: a meta-analysis´, Journal of International Money and Finance, 33, 255—281.
Publisher – Google Scholar
5. Chakraborty, I. (2010), ´Capital structure in an emerging stock market: The case of India´, Research in International Business and Finance, 24 (3), 295-314.
Publisher – Google Scholar
6. Deloof, M. (2003), ´Does working capital management affect profitability of Belgian firms´, Journal of Business and Finance Accounting, 30, 573-587.
Publisher – Google Scholar
7. Eljelly, A. (2004), ´Liquidity-profitability tradeoff: An empirical investigation in an emerging market, International Journal of Commerce & Management´, 14 (2), 48 — 61.
Publisher – Google Scholar
8. Jose, M.L., Lancaster, C and Stevens, J.L. (1996), ´Corporate returns and cash conversion cycles´, Journal of Economics and Finance, 20 (1), 33-46.
Publisher – Google Scholar
9. Laeven, L., Valencia, F. (2012), ´Systemic banking crises database: an update´, IMF Working Paper, 12/163,[Online], Retrieved October 24, 2015], https://www.imf.org/external/pubs/ft/wp/2012/wp12163.pdf
Google Scholar
10. Lazaridis, J., Tryfonidis, D. (2006), ´Relationship between working capital management and profitability of listed companies in the Athens stock exchange´, Journal of Financial and Managerial Analysis, 19, 26- 35.
Google Scholar
11. Myers S. C. (1984), ´Corporate financing and investment decisions when firms have information that investors do not have´, Journal of Financial Economics, 13, 187-221.
Google Scholar
12. Modigliani F., Miller M.H. (1958), ´The cost of capital, corporation finance and the theory of Investment´, American Economic Review, 48, 261-297.
Google Scholar
13. Modigliani F., Miller M.H. (1963), ´Corporate income taxes and the cost of capital: A correction´, The American Economic Review, 53 (3), 433-443.
Google Scholar
14. Ozkan, A., Ozkan, N. (2004), ´Corporate cash holdings: An empirical investigation of UK companies´, Journal of Banking and Finance, 28, 2103 — 2134.
Publisher – Google Scholar
15. Rajan R.G., Zingales L. (1995), ´What do we know about capital structure? Some evidence from international data´, The Journal of Finance, 59 (5), 1421-1460.
Publisher – Google Scholar
16. National Bank of Romania, (2011) „Financial stability report´ pp. 99. [Online], [Retrieved October 24, 2015], http://www.conta-conta.ro/miscellaneous/835_miscellaneous_contabilitate_files%20835_.pdf
17. Smith, K. (1980), Profitability versus liquidity trade offs in working capital management, Readings on the management of working capital, K. Smith (ed), St Paul: West Publishing Company.


