Literature Review
In the literature review body, we can identify two major directions: general country of origin effect regarding wine-similar to country of origin effect regarding any other product durable or non-durable and specific country of origin effect regarding wine only.
The general effect includes: quality assessment, consumer perceptions, information processing, decision making, consumer preferences, purchasing decision, price.
The specific country of origin effect regarding wine only refers to the country of origin as an extrinsic wine cue, wine labels, wine range, wine consumers, domestic versus foreign wines.
Extrinsic cue
Intrinsic cues of the wine such as taste and aroma cannot be usually evaluated by consumers during the buying decision process, or be assessed by visual inspection of the wine in the store, and many consumers take little or no effort for external search before entering the store (Chaney, 2002). Even when this intrinsic information is available, like actual tastings, consumers rely on the origin of the wine in the decision making process. (Halstead, 2002), (Goodman, Lockshin and Cohen, 2007), (Veale and Quester, 2008)
Therefore, extrinsic cues and mainly the country of origin or region of origin are most important for consumers.(Samiee, 1994), (Nebenzahl, Jaffe and Lampert, 1997)
Although extrinsic cues have no direct bearing on the quality of wine, consumers used them as indirect indicators or substitutes for intrinsic cues (Bilkey and Nes, 1982) or assign a meaning to an entire wine class (Goldberg and Baumgartner, 2002). Country of origin information, price and brand might be used by consumers as extrinsic factors in quality assessment. (Hu et al., 2008)
Wine labels
Labels are relevant in the buying decision of wine for home, party, bar/restaurant consumption for all the consumers (Wolf and Thomas 2007) and especially for wine novices. (Boudreaux and Palmer, 2007).
Consumers between 21 and 40 years old found wine labels more intimidating than consumers over 60. Consumers under 30 prefer more creative labels (Qenani-Petrela, Wolf and Zuckerman, 2007) and women use color, image and logo as indicators of purchasing intents more than men do. (Barber, Almanza and Donovan 2006)
There is a positive relationship between label attractiveness, eye-catching properties and buying decision (Wolf and Thomas, 2007). Consumers rated the country of origin as the most important attribute of the label (Barber, Almanza and Donovan 2006), although images and colors on the label have strong effects as well. (Boudreaux and Palmer, 2007)
Wine labels are considered a risk reduction strategy (Skuras and Vakrou, 2002) and more reliable compared to wine publications. (Barber, Almanza and Donovan 2006)
Wine range
Hansard (2010) emphasized the relationship between the country of origin of wine and wine range. Quality is crucial for Top Range wines, as well as for Medium range wines. Price is critical for Entry Level, as well as for Medium Range wines. What matters most apart from quality and price is price stability and quality consistency both for Entry Level and Medium Range wines and price/quality ratio for Medium Range wines. For bulk wines, price and size of supply volumes are the most important. Country of origin or region of origin matters most for Top Range wines and Medium Range wines.
Wine consumers
It all depends on what kind of consumer you are: for non-wine connaisseurs knowing the country or region of origin makes buying easier; for new consumers intrinsic attributes got a great importance (Thomas and Pickering, 2003); for less experienced consumers medal cues are important (Orth, 2002); for less frequent buyers price is very important (Batt and Dean, 2000); for frequent buyers brand is the most important (Batt and Dean, 2000); for wine connaisseurs the wine company, wine brand and experts’ opinions on wine matter most (Thomas and Pickering, 2003); and for wine experts country or region of origin matters most. (Rasmussen and Lockshin, 1999)
Domestic versus foreign wine
Often, if the country of origin of the wine is a developed country or a known wine making, this is considered to be a quality insurance, while if the country of origin of the wine is a less developed country or a less known wine making, the quality of the wine is considered lower. (Kaynak, Kucukemiroglu and Hyder, 2000)
French wines are considered to be expensive, but too dry and rough, Italian wines are considered of a lower quality compared to the French ones, yet a better value for the money, Spanish wines are considered cheap and rough, German wines are considered to be safe and reliable (Gluckman, 1990). Canadian wines are perceived of a lower quality compared to French, Italian, Spanish and German wines. (Wall and Heslop, 1986)
The quality of the Romanian wines significantly improved after the communist period, having France as a model in wine strategy. (Jubénot, 2014)
The aim and the hypothesis
The aim of this paper is to investigate if the reputation of the country of origin of the wine influences the opinions of the consumers and the purchase decisions.
The research hypotheses are:
H1: The information regarding the country of origin of the wine matters in the purchase decision.
H2: The reputation of the country of origin of wine influences the buying attitude of the consumers.
H3: The perception of the consumers on the reputation of the country of origin of the wine depends on the perception of the consumers on the reputation and the price of the wine.
H4: Country of origin of the wine is the most important extrinsic cue for the purchase decision of the consumers regarding the wine.
H5: The opinions of the consumers and the masters of wine regarding the reputation of the country of origin of wine are convergent.
Methodology
The Sample
The sample of respondents consists of four groups: Romanian consumers-RC, international consumers-IC, Romanian winemakers, International Masters of wine, as follows: 52 RC in real buying circumstances during an International Wine Fair held in Bucharest in December 2015; 51 IC also in real buying circumstances in London and Madrid. The IC were participants at two international conferences held in London and in Madrid, the same as the author and the questionnaires were filled in the evening before leaving by those participants who actually bought wine as a gift for families and friends.
All the consumers were asked to fill in the questionnaires after buying at least a bottle of wine. 52 Romanian winemakers during the above mentioned Wine Fair and 59 Masters of wine filled in the questionnaires in January 2016 by email. For opinions, beliefs, assessing quality, any kind of consumer could be used in research, yet for intention to buy or purchase decision, real buyers would be more appropriate, because they can refer to an actual decision or intention, instead of a potential one. Apart from the opinions of the consumers, the opinions of winemakers and Masters of wine are considered an added value due to their specific expertise.
The Methods
Quantitative methods were used, namely questionnaires, in Romanian for RC and winemakers and in English for IC and Masters of wine. To analyze the questionnaires, frequency distribution, factor analysis, ANOVA, linear regression in SPSS were used.
Therefore, for this study the consumers are men or women (in similar proportions), mainly between 25 and 34 years old for IC and between 35 and 50 years old for RC, seeing themselves as having an average income, buying mainly when needed for IC and occasionally for RC, mainly for a celebration for IC and for themselves for RC. IC were from: Algeria, Bulgaria, Colombia, Czech Republic, Germany, Hungary, India, Italy, Jordan, Korea, Nigeria, Poland, Portugal, South Africa, Slovakia, Slovenia, Spain, Thailand, Turkey, UK, USA and the country of origin of the wine they have bought was: Australia, Bulgaria, Chile, France, Germany, Italy, Moldavia, Portugal, South Africa, Spain, UK. The country of origin of the wine bought by RC was: France, Germany, Moldavia, Portugal, Romania.
Out of the 52 Romanian winemakers, 18 work for less than 5 years in this business ( 34.61%), 14 are in the business for 5 to 10 years (26.92%), 12 for 10 to 20 years(23.07%) and 9 for more than 20 years (17.30%).
Their jobs in the wineries they represent are: brand manager(2), commercial manager(2), export manager (1), internship (1), Master of wine OIV(1), marketing manager (4), oenologist (6), PR manager (1), sales manager (10), sommelier (5), Weset level 2(1), wine manager and promoter (4), wine seller (5), wine specialist (2), winemaker (9). Apart from being Master of wine, the 59 Masters who were kind to fill in the questionnaires are also involved in wine consulting, wine education, journalism, wine buying, wine import and export, wine selling, some of them have their own wineries or are winemakers.
Only 2 out of 59 are Masters of wine for less than 5 years and only 3 are Masters of wine for 5 to 10 years, 15 of them are Masters of wine for 10 to 20 years and the rest of 38 for more than 20 years. Both the opinions of the Masters of wine and of the winemakers are valuable due to their great experience.
The findings
The findings regarding the opinions
The consumers were asked to fill in their opinions regarding the following 10 countries: China, France, Germany, Hungary, Italy, Romania, Russia, Spain, UK, USA and ten sentences regarding each of the mentioned countries.The 10×10 matrix model was used with countries as lines and sentences as columns and a 7 points Likert scale was chosen with 1 as least important and 7 as most important. The results for consumers are presented in the following charts. SPSS was used to compute the means.
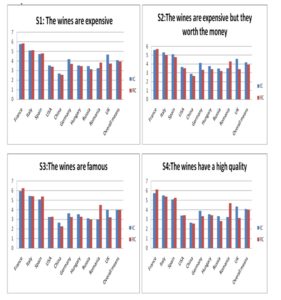
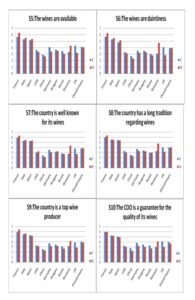
Figure 1-10: The means for the opinions of the consumers
Author’s figures, based on the results of the questionnaires
The sentences were grouped in COO features (S7-S10) and Wine features (S1-S6) and the averages for the two groups were compared. Both for IC and RC, opinions on wine features matter more than on COO features, yet the difference between the two groups is smaller for IC. The averages for IC are bigger than those for RC for both groups, 4.06 compared to 3.98 for wine features and 3.95 compared to 3.87 for COO features. Although the differences between means are quite small, we will get a better view by looking at the way the consumers ranked the countries according to the 10 sentences.
There is a consistency of ranks for IC; the only changing among sentences is for Romania and Russia, each holding the eighth place five times and the ninth place five times.
For RC, only Germany, Hungary, UK and USA are changing the fifth, sixth, seventh and eighth place among them. When comparing the ranks between IC and RC, we can see that they have the same opinions for the top three places: France, Italy, Spain, as well as for the last place: China, they also agree for Russia, Hungary and USA for half of the cases.
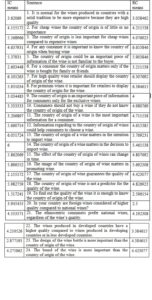
The winemakers and the Masters of wine expressed their opinions on the following 24 sentences using a 7 point Likert scale from 1 for least important to 7 for most important. SPSS was used for the means of the answers.
Table 1: The winemakers and the Masters of wine scores
Author’s table, based on the results of the questionnaires
The major differences were for sentences 17 and 4 where RC got higher scores, other important differences are for sentences 23, 11, 10, where again RC got higher scores compared to IC, while for sentences 20, 18, 15, 12, 3 IC got higher scores. For the rest of the 14 sentences, the differences between IC and RC are not significant.
The opinions of Romanian producers and of the Masters of wine
A factor analysis using SPSS was made for the Masters of wine and for the Romanian winemakers. For the Masters of wine, the highest correlations are for the following pairs of sentences, with the following correlation coefficients: S2 and S3-0.636, S13 and S14-0.866, S17 and S19-0.674.
The value of KMO test for measuring the sampling adequacy is 0.538 with Sig=0.000. Eight factors were identified by the analysis, explaining 71.07% of the variance. The first factor “COO and wine quality” explains 17.04% of variance and includes S17 and S19 as initial variables. The second factor “COO and wine imports” explains 15.58% of variance and includes S13 and S14 as initial variables.
For the Romanian winemakers, the highest correlations are for the following pairs of sentences, with the following correlation coefficients: S19 and S20-0.668, S4 and S8-0.613.
The value of KMO test for measuring the sampling adequacy is 0.505 with Sig=0.000. Eight factors were identified by the analysis, explaining 70.06% of the variance. The first factor “COO and wine quality” explains 19.08% of variance and includes S1, S9, S19, S20 and S22 as initial variables. The second factor, “Importance of COO”, explains 12.68% of the variance and includes S4, S7 and S8 as initial variables. The next six factors explain less than 10% of the variance each in either case.
Top countries as seen by the Masters of wine
The Masters of wine were asked to make top 3 countries regarding
- The best wines they had tasted;
- The most famous wines in their opinion;
- With the most expensive wines;
- With the widely known wine tradition;
- As successful new players in the wine market;
- As the main players in the wine market
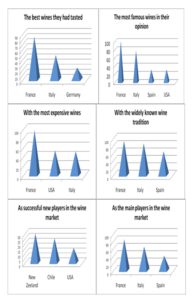
Figures: 11-16: Top 3 countries as seen by the Masters of wine
Author’s figures, based on the results of the questionnaires
The opinions of the Masters of wine regarding items A, B, C, D and F are consistent with the opinions of both IC and RC for France, Italy and Spain. Masters of wine have a higher opinion on Germany than RC and a higher opinion on USA than IC and RC. On item E, the answers were really diverse, including countries from South America (Chile, Brazil, Argentina), New Zeeland, Australia, South Africa, countries from Europe (Greece, Austria, UK, Hungary, Portugal, Cyprus, Croatia, Romania, Slovenia), countries from North America (USA, Canada), countries from Asia (China, Georgia, Turkey).
The Results for the purchase decision
The consumers were asked to rank for the wine they just have bought how important were the following cues for the purchase decision, using a 7 points Likert scale, with 1 for the least important and 7 for the most important.
C1. The quality of the wine;
C2. The price of the wine;
C3. The fame of the wine;
C4. The availability of the wine;
C5. The COO of the wine is among the top wine producers;
C6. The COO of the wine is well known for its wines;
C7. The COO of the wine is among the top wine exporters.
A factor analysis using SPSS was made. The findings are as follows:
For IC, the top 3 correlations could be explained by the COO effect, specifically the correlations between C5 and C7(0.609), C7 and C4(0.487), C5 and C4(0.417). For RC, the top 3 correlations could be explained by the COO effect, specifically the correlations between C5 and C6(0.661), C5 and C7(0.584), C6 and C7(0.579). The KMO coefficient is 0.688 for IC and 0.601 for RC, both of them with Sig=0.000.
For IC, four principal components were identified, explaining 67.493% of the total variance. The first component includes the initial variables C7(0.848), C5(0.798), C4(0.700), C1(0.632) and explains 35.38% of the variance. The second component includes just C2(0.838) and explains 16,83% and the third component includes just C6(0.916) and explains 15.29%.
For RC, three principal components were identified, explaining 64.28% of the total variance. The first component includes C5(0.815), C4(0.795), C7(0.780), C6(0.760), C3(0.633) and C1(0.628) and explains 47.43%. The second component includes just C2(0.965) and explains 16.85%.
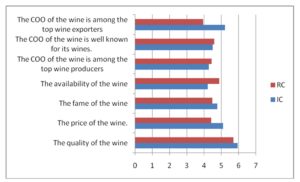
Figure 17: The means for purchase decision
Author’s figure, based on the results of the questionnaires
Table 4 allows us to see the main similarities and differences between IC and RC. Similarities: both IC and RC considered the quality of the wine as the main cue in purchase decision and the fame of the wine stands on the fourth place. Differences show an interesting symmetry, for instance, the availability stands on the second place for RC and on the last place for IC, COO is well known for its wines stands on the second place for IC and on the last place for RC. Price stands on the third place for IC and only on the sixth place for RC. For RC is important that COO is among the top wine exporters (third place), yet only on the fifth place for IC. COO is among the top wine producers stand on the fifth place for RC and on the sixth place for IC.
ANOVA was used to analyze the influences of age, gender or income on purchase decision (C1-C7) for IC and RC. The findings showed that gender has no influence on purchase decision for IC and for RC, due to the fact that Sig>0.05, therefore the null hypothesis cannot be rejected.
The age of RC influenced the purchase decision only on two variables: C4-The availability of the wine (Sig=0.000) and C6-The COO of the wine is well known for its wines (Sig=0.026). For IC, the age influenced only C1-The quality of the wine (Sig=0.033). The same variable C1 is influenced by income (Sig=0.045) for IC and for RC the income has no influence on purchase decision.
Conclusions
For consumers’ opinion, the averages for COO cues are slightly smaller than the wine cues for IC and for RC, meaning the cues regarding the wine are more important compared to the cues regarding COO or ROO. The top 3 countries for all cues in consumers’ opinions are the same as the top 3 countries in the opinions of the Masters of wine, namely France, Italy, Spain. All three countries are perceived as countries with great tradition and well known for wine, top wine producers and wine exporters, main players in the wine market.
In the opinion of Romanian winemakers and of the Masters of wine, the first factor “COO and the wine quality” explains 17.04% for the Masters of wine and 19.08% for the Romanian winemakers of the total variance, emphasizing a strong correlation between the COO and the perceived quality of the wine, that is consistent with the consumers’ opinions.
For purchase decision, what mattered most was the quality of the wine for IC, as well as for RC. Now, how could a consumer know the quality of the wine at the purchase point? Of course, if the consumer has expertise on wine, won’t be too difficult to process the information on label and take a rational decision. But it was not the case for IC or RC, because only 15.68%, respectively 13.46%, bought wine on a regular basis and their personal opinion weights more than other people’s recommendations on buying intention. Therefore, at purchase point, an average consumer decides the wine meets his/hers quality expectations based on the information written on the label. Along with price, COO/ROO are strong predictors for quality.
Again, the averages for COO cues are higher than for wine cues, 4.98 compared to 4.68 for IC and 4.66 compared to 4.58 for RC, unlike for consumers’ opinions. Therefore, hypotheses H1, H2 and H5 are supported. H3 is partially supported only for IC. Hypothesis H4 is rejected and we can conclude that the reputation of the COO did not depend on the price of the wine for both IC and RC and might be explained by the reputation of the wine for IC and by the reputation of the brand of the wine for RC.
References
1. Barber, N., Almanza BA. and Donovan, JR. (2006), ‘Motivational Factors of Gender, Income and Age on Selection a Bottle of Wine’, International Journal of Wine Marketing, 18 (3), 218-32
Publisher – Google scholar
2. Batt, PJ. and Dean, A. (2000), ‘Factors influencing the consumer’s decision’ The Australian and New Zealand Wine Industry Journal, 15 (4), 34-41
3. Bilkey, WJ. and Nes, E. (1982), ‘Country-of-origin effects on product evaluations’, Journal of International Business Studies, 13 (1), 89-99
4. Boudreaux CA. and Palmer, SE. (2007), ‘ Charming Little Cabernet, Effects on Wine Label Design on Purchase Intent and Brand Personality’, International Journal of Wine Business Research, 19 (3), 170-86
Publisher– Google scholar
5. Chaney, IM. (2002), ‘Promoting wine by country’, International Journal of Wine Marketing, 14 (1), 34-64
Publisher– Google scholar
6. Gluckman, RL. (1990). ‘A consumer approach to branded wines’, European Journal of Marketing, 24 (4), 27-46
7. Goldberg, ME. and Baumgartner, H. (2002). ‘Cross-country attraction as a motivation for product consumption’, Journal of Business Research, 55, 901-6
Publisher– Google scholar
8. Goodman, S., Lockshin, L. and Cohen, E. (2007). ‘Influencers of consumer choice — comparing international markets’, Wine Industry Journal, 22 (3), 91-5
9. Halstead, L. (2002). ‘How do consumers select wine? Factors that affect the purchase decision making process in the wine category’ Annual Academy of Marketing, Nottingham
10. Hansard, T.L. (2010), ‘Analysis of American and Australian preferred wine label attributes’, digitalcommons.calpoly.edu
11. Hu, X., Li, L., Xie, C. and Zhou, J. (2008), ‘The effects of country-of-origin on Chinese consumers’ wine purchasing behavior’, Journal of Technology Management in China, 3 (3), 292-306
Publisher– Google scholar
12. Jubénot, M.-N. (2014), ‘Highlights of Romanian and French wine markets: the example of French champagne market’, Annals of the University of Oradea, Economic Science Series, 23 (2), 95-105
13. Kaynak, E., Kucukemiroglu, O. and Hyder, AS. (2000), ‘Consumers’ country-of-origin (COO)perceptions of imported products in a homogeneous less-developed country’, European Journal of Marketing, 34 (9/10), 1221-31
Publisher– Google scholar
14. Nebenzahl, ID., Jaffe, ED. and Lampert, SI. (1997), ‘Towards a theory of country image effect on product evaluation’, Management International Review, 37 (1), 27-49
15. Orth, U. (2002), ‘Research note: Targeting the un-experienced and the convenience shopper’, International Journal of Wine Marketing, 14 (3), 80-2
Publisher– Google scholar
16. Qenani-Petrela, E., Wolf, M. and Zuckerman, B. (2007), ‘Generational Differences in Wine Consumption’, Journal of Food Distribution Research, 38 (1), 119-27
17. Rasmussen, M. and Lockshin, L. (1999), ‘Wine choice behaviour: The effect of regional branding’, International Journal of Wine Marketing, 11 (1), 36-46
Publisher– Google scholar
18. Samiee, S. (1994), ‘Customer evaluation of products in a global market’, Journal of International Business Studies, 25 (3), 579-604
Publicher– Google scholar
19. Skuras, D., and Vakrou, A. (2002), ‘Consumers’ willingness to pay for origin labelled wine: A Greek case study’. British Food Journal, 104 (10/11), 898-912
Publicher– Google scholar
20. Thomas, A. and Pickering, G. (2003), ‘The importance of wine label information’, International Journal of Wine Marketing, 15 (2), 58-74
Published– Google scholar
21. Veale, R. and Quester, P. (2007), ‘Consumer expertise: Measuring consumer objective knowledge’ Proceedings of ANZMAC 2007, 2007 / Ken Deans (ed./s), 2109-14
22. Wall, M. and Heslop, LA. (1986), ‘Consumer attitudes towards Canadian-made versus
imported products’, Journal of the Academy of Marketing Science, 14 (2), 27-36
23. Wolf, MM. and Thomas, SM. (2007), ‘How Millennial, Generation X, and Baby Boomer Wine Consumers Evaluate Wine Labels’, Journal of Food Distribution Research, 38 (1), 170-81
Publisher- Google scholar


