Introduction
Climate change driven by the accelerative growth of global warming has become a common threat, affecting many sectors such as agriculture, food, industry, tourism, transportation and health. However, climate change has the most profound effect on agriculture. Greenhouse gas which is the major indicator that shows how much an environment has been affected by global warming, has risen in a very accelerative trend especially after the 1990s. Increase in food prices, water scarcity, droughts and other natural disasters lead us to study the impact of climate change on agricultural sector.
The relationship between agriculture and climate change can be discussed in three aspects according to Dellal and McCarl (2007). The first category is the impact of climate change on agriculture. The efficiency of agricultural products and the cost of production are influenced by the temperature, precipitation, the amount of carbon dioxide in the atmosphere and extreme natural events like droughts. Those impacts can change the harvest time of agricultural products and efficiency of feeding grounds. In addition, droughts or floods may occur due to less or more precipitation and these extreme events cause loss in agricultural production. Therefore, the cost of production changes. Land appropriateness is another significant factor that is influenced by climate change. Besides the temperature and precipitation, the water saturation of land, the capacity of land for storing, the saturation and land efficiency are also very important. Water scarcity and supply of water irrigation can be changed as a result of the decrease in the volume of water level and increase in evaporation. On the other hand, supply of water which is used in irrigation can decrease due to rising demand from other industries and households as a result of high temperatures. Efficiency of animal products and cost of production are other areas of agriculture that are affected by climate change. Rise in the temperature can affect the balance of the temperature in the bodies of animals and through this imbalance, death rates, consumption of animal feed, increase in the weight of animals, milk production and pregnancy levels can change (Dellal and McCarl, 2007). Similar to food production, these factors also change the cost of production. The second category of the relationship between agriculture and climate change is the opposite of the first category, the impacts of agriculture on climate change. Besides the fact that climate change affects agriculture, also agricultural productions like livestock and rice production, fertilizer and land usage can also affect climate change. Ruminant animals, rice which is grown in the water, dissolution of fertilizers and stomach fermentations cause release of greenhouse gases (Dellal and McCarl, 2007). According to the report of International Panel on Climate Change (2007), 26% of the greenhouse gas in the world is derived from energy consumption, 19% is from industry facilities, and 17% is from the change in the usage of land, while 14% is from agriculture and 13% from the transportation. The third category concerns another aspect of agriculture which helps to decelerate climate change. Dellal and McCarl (2007) claim that agriculture also has positive influences on the climate. Climate change is accelerated by the increase in greenhouse gas (GHG). On the other hand, some plants stocks carbon in their green parts during photosynthesis. By increasing the amount of green plants, release of greenhouse gases can be decreased. Another contribution of agriculture in decreasing the climate change is bio fuels. In contrast to fossil fuels, usage of bio fuels decreases the GHG.
In this study, the major determinants of agricultural trade capability, including climate change indicators are analyzed for Turkey and its major rivals in the European food market. As a global actor in agricultural trade, Turkey ranks 16th in global agricultural exports. However, there are very rare academic studies for emerging markets including Turkey. In addition, Turkey has taken the climate change as a serious threat in this period because projections show that the agricultural sector of Turkey will be influenced immensely. As a first step, the European food market is selected because out of the top 15 destinations in agricultural export, ten countries are European countries. As a second step, the major rivals of Turkey are determined in the European food market. Then, panel data models are employed to identify the relation between the agricultural sector and climate change through the concept of international trade for 16 countries for the period of 1990-2008. Major determinants are classified as traditional, agricultural production capability and climate change variables. Most common climate change indicators are carbon dioxide emission and intensity of this emission including a specific index developed by the World Bank, called particulate emission damage. The striking finding for the emerging countries is that carbon dioxide emission and particulate emission damage deteriorates the agricultural trade capability in the emerging countries. Emerging countries have to take proper actions for dealing with global warming in order not to lose competitive power in the European food market. However, empirical evidence reveals the contrary results for the developed countries (DCs). Particulate emission damage which is the willingness to pay to avoid mortality attributable to particulate emissions in a country and carbon dioxide emission have a positive influence on agricultural trade capability. This finding may state that DCs can control carbon dioxide emission better than the emerging countries in the sample and improve agricultural productivity through technological and industrial developments. In addition, carbon dioxide intensity supports the hypotheses that agricultural trade capability of the emerging and DCs have been influenced negatively from climate change. Turkey as a growing economic power has serious current account deficit problems. So, there are additional macroeconomic outcomes of this threat resulting from balance of payments and international trade effect.
The main contributions of this study to the literature are: (1) its being one of the first studies that considers three main topics, agriculture, international trade and climate change, simultaneously and its using a macroeconomic approach to analyze the impact of climate change on agricultural trade capability of Turkey and its competitors; (2) Its investigation of the underlined factors of competition in the European food market for the major rivals; (3) Its analysis of agricultural trade by taking into account traditional agricultural production capability factors as well as agricultural infrastructure and capacity indicators besides climate change.
The rest of the paper is organized as follows. In section II general trends and characteristics of the agricultural sector and international trade in the world and in Turkey are highlighted. The literature on the effects of climate change on agriculture, international and agricultural trade is reviewed in section III. Methodology and data are presented briefly in section IV. Main empirical findings and policy implications are discussed in section V. Concluding remarks are presented at the end.
The Impact of Climate Change on Agricultural Production and Trade
Global climate change or the most popular usage, global warming is the raise in the average temperature of the Earth’s surface due to the accelerative influence of greenhouse gas emissions sent to the atmosphere (Dellal and Butt, 2005). Global surface temperature increased 0.74 ± 0.18 °C (1.33 ± 0.32 °F) during the last century. An increase in temperature causes many environmental problems such as abnormalities in the hydrologic balance of the world, melting of ices, decrease in the snow volume, increase in the sea level, raise in the number and harshness of climate events, droughts, desertification and the outbreak illnesses within (IPCC, 2007).
There are different numbers of models or scenarios related to the concept of global warming. The models related to the global warming or agriculture generally are related to greenhouse gas emissions, gas concentrations, temperature changes, impacts on agriculture or impacts on agricultural trade. Four types of scenarios according to the Intergovernmental Panel on Climate Change (IPCC) are presented in Table 1.
Table 1. Scenario Families of Intergovernmental Panel on Climate Change
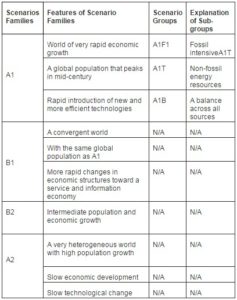
Four potential scenarios are grouped as A1, A2, B1 and B2 according to various technological, demographic and economic developments (IPCC, 2007). Subdivisions of scenarios are classified according to different choices of energy sources, reflecting the care for environmental issues. A1 assumes a sudden growth in the economy, an increased global population and also more technological developments. A1 scenario is divided into three categories: A1FI which explains that usage of fossil intensive sources will be expected, A1T which expects the usage of non-fossil energy sources and A1B which is a kind of a balance between these two scenarios. On the other hand, B1 scenario assumes the same global population but with a difference in economic structures toward an information economy. Furthermore, B2 scenario describes a medium rate of growth on economy and population and focuses on local solutions for the climate change driven problems. The last scenario, A2, is a kind of radical. It assumes an increasing trend in population though the opposite for technological development and economic growth (Parry, Rosenzweig, Iglesias, Livermore and Fischer, 2004). After the global crisis faced in 2008, scenario B2 seems much closer to reality than the other scenarios.
Global warming and climate change is a global problem so global coordination and collective actions are required. The Kyoto Protocol was one of the primary actions taken to increase the world’s awareness. Recently, the EU has three objectives which are related to energy in order to go back to desired emission levels by 2020: improving energy efficiency and a 20% decline in the energy consumption; raising the shares of renewable energy in the market up to 20% and share for bio fuels to 10% in each EU country. In addition, the EU has a system to improve energy efficiency, called EU Emission Trading System (EU ETS). Some sectors like aviation will lower emission levels by 21% by the end of 2020. The emission levels stemming from transport (except aviation), agriculture and waste sectors are very high at about 60% (European Commission, 2008). The EU also proposes emission level reduction for these sectors by 10% till 2020. Additionally, the EU raised its research budget in order to discover clean deployment technologies and also supports other countries in taking actions against global warming. The insistence of the EU in fighting against global warming is very clear. The EU acts as a leader, taking advantage of its position to be the first mover of projects, campaigns, preventions and promotions. The endeavor achieved by EU will be encouraging for the rest of the world.
Food is the basic necessity for human being to survive and has been a major problem due to increasing population in the world. Some researchers project that if the required policy actions are not taken, there will be 1300 million people who will be at risk of hunger in the 2080s (Slater, Peskett, Ludi and Brown, 2007). Therefore, agriculture is one of the most significant topics that have been discussed from different aspects. Water scarcity, degradation of abundant lands and change in the level of precipitation are the natural resource based problems for agriculture. Moreover, demographic impacts like migration can also affect agricultural production because generally, rural population works in the agricultural sector. Producers will prefer to produce the products which face scarcity in order to gain the market share and money if the lands that they operate are available for the production. So the structure of agricultural production in different regions of the world will change (Slater, Peskett, Ludi and Brown, 2007). Domestic supply of agricultural products by countries, balances of production between producers and consumers, prices and transportation costs will change the volume and pattern of trade in the world. Consequently, there will be changes in trade balances of countries which are effective and dominant in the world’s agricultural sector (Gassebner, Keck and The, 2006).
Figure 1 shows the share of agricultural production in global gross domestic product (GDP) for the country groups as well as for the world. Country groupings are based on their GDP level.
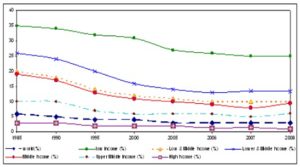
Figure 1: Share of Agricultural Output in GDP (%)
Source: World Bank database (http://data.worldbank.org/indicator)
The general trend in global agricultural production seems to decline from 6% in 1985 to 3% in 2008. The biggest share of the agricultural output in GDP belongs to low income countries with shares of 35% and 25% in 1985 and 2008, respectively. High income countries have the lowest share with 3% in 1985 and 1% in 2008. As the countries climb industrialization stages, their share of agricultural output in GDP declines. Turkey is classified as an upper-middle income country and produces 2% to 4% of the world’s agricultural production over the period 1990 and 2008.
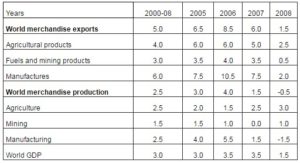
Merchandise trade includes mining, manufacturing and agricultural products. The shares of various sectors in global merchandise export and production are presented in Table 2.
Table 2: Growth in the Volume of World Merchandise Exports and Production, 2000-2008
(Annual Percentage Change)
Source: World Trade Organization database (http://stat.wto.org/StatisticalProgram)
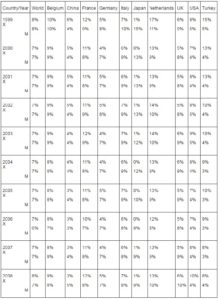
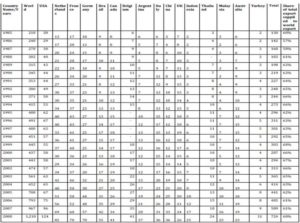
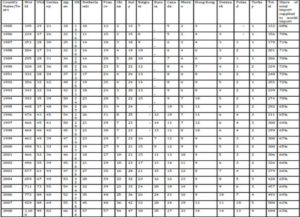
International trade continues to grow parallel to global output till 2007. However, merchandise production has declined due to the global crisis in 2008 although merchandise trade continued to grow. Agricultural output grew about 2.5% while agricultural exports rose more at rate of 4% between 2000 and 2008. The striking feature is that agricultural production and exports rise by 3% and 2.5% during the crisis year, 2008. Agricultural trade is growing higher than trade of fuels and mining products while the manufacturing is contacting in 2008. Leading exporters and importers of food in merchandise trade in the world are given in Table 1A and 2A in the Appendix. The top food exporters in the world are the USA, the Netherlands, France, Germany and Brazil. Turkey ranks 16th with 11 billion USD export in food. Turkey has a competitive advantage in food export despite its limited arable land compared to the major rivals. Its share in agricultural production could be an indicator of Turkey’s good performance in production despite the priority given to industrialization policies in the last three decades. The leaders of food imports in the world are the USA, Germany, Japan, the UK and the Netherlands. The top 16 food importers have a share of 63% in total imports. However, their share declined from 72% in the first half of the 1990s to 63% in 2008. A similar trend is observed for Turkey. Food imports rose significantly from 1 billion USD in 1985 to 9 billion USD in 2008. At the end of 2008, world agricultural imports made in the world, were approximately 1.1 billion USD. The share of agricultural exports in total merchandise exports for the major merchandise exporter countries and Turkey is presented in Table 3.
Table 3: Ratio of Agricultural Exports and Imports in Total Merchandise Exports in the Major Merchandise Trade Countries and Turkey (%)
Source: World Bank database (http://data.worldbank.org/indicator)
There is a declining trend in the share of agricultural export in merchandise export for the middle income countries like China and Turkey. The weight of agricultural export in middle income countries’ and high income countries’ GDP is less in contrast to high income countries. Developed countries such as the USA, the UK and France seem to have rising shares in the second half of the 2000s. Belgium, Germany, Italy, and Japan maintain the same share in GDP. On the other hand, more stable shares are observed regarding agricultural imports. Major agricultural importer countries show a slight decline in the share of agricultural imports in merchandise trade between 1999 and 2008, except Japan. Turkey is one of the major actors in global agricultural trade and has a competitive advantage in trading and production in the world. Therefore, Turkey should take proper actions to minimize the devastating effects of climate change in order not to lose its competitive power. In addition, with its current account deficit problems, any negative impact from exports may accelerate the current deficit problem and trigger other macroeconomic problems.
Literature Review
An academic literature about global warming and climate change mainly focuses on curbing climate change by decreasing GHG emission. Many academicians and researchers believe that this can be done only by international consensus. Adaptation and mitigation strategies are pointed out by non-governmental organizations (NGO) all over the world. The World Trade Organization (WTO) has a committee in the agricultural special session. The negotiations on agriculture contain non-trade concerns, food security, special and differential treatment, market access, domestic support, export competition, state trading enterprises, peace clause and cross linkages sections. The negotiations concerning food security offer advice on handling the negative impacts of global warming on agricultural international trade. Basic advices is ensuring stable and predictable export earnings to build up critical foreign exchange reserves for the purchase of food on reasonable terms and conditions and in a timely manner; ensuring physical access to food through accessing different and adequate supply sources; securing effective and reliable transportation and storage facilities and encouraging domestic agricultural production while taking into account various constraints of a topographic or agro-climatic nature. The World Bank Development Research Group’s Sustainable Rural and Urban Development Team study the influence of climate change in the African Cropland. Seo et al., (2008a, 2008b) research distribution of climate change impacts across the 16 agro-ecological zones in Africa and how African farmers adapt to the climate change with the purpose of helping farmers and policy makers in order to identify efficient adaptation strategies for climate change. The analysis of agro-ecological zones implies that the effects of climate change will vary across Africa and some locations are more affected than others. With a clement climate scenario, African farmers gain from climate change; with a more severe scenario, they lose.
Parry et al. (2004) point out the effect of climate change on global food production and the risk of hunger. In this research, the Special Report on Emissions Scenarios (SRES) is utilized and methods for impacts and adaptation at the crop level are discussed. Basic Link System (BLS) developed by Food and Agriculture Program of the International Institute for Applied Systems Analysis is used to evaluate consequent changes in global cereal production, cereal prices and the number of people at risk from hunger. The most appropriate method is found for each scenario. In addition to the climate’s impacts on food production, the article also points out the risk of hunger which is also one of the significant concerns of the world. Tubiello and Fischer (2007) try to provide answers to questions about reducing climate change impacts on agriculture under two distinct sets of climate simulations: 1) A non-mitigated scenario, with atmospheric CO2 concentrations over 800 parts per million (ppm) by 2100, 2) A mitigation scenario, with CO2 concentrations stabilized at 550 ppm by 2100. Projections for impacts of climate change on crop yield are evaluated for the period 1990–2080. The results suggest that mitigation can positively impact agriculture. With mitigation, global costs of climate change are reduced by 75–100%; and the number of additional people at risk of malnutrition is reduced by 80–95%. Significant geographic and temporal differences are found. Regional effects often diverge from global net results, with some regions worse off under mitigation compared to the unmitigated case. According to Romar (2009) and Faris (2007), the impact of global warming on agriculture can be catastrophic. They claim that global warming is the main reason behind the events in Darfur which is accepted as an ethnicity problem all over the world. The real reasons were drought and failing of lands.
The impact of global warming on international trade has been studied at an industrial regional and global level. Copeland and Taylor (2001) discuss the relationship between free trade and global warming in the context of the general equilibrium trade model and argue that in an open trading world: (1) Unilateral emission reductions by the rich North can create self interested emission reductions by the unconstrained poor South. (2) Simple rules for allocating emission reductions across countries may be well efficient even if international trade in emission permits is not allowed. (3) When international emission permit trade does occur, it may make both participants in the trade worse off and increase global emissions. The main conclusion is that international trade can be radically affected according to different environmental conditions. Fischer et al., (2005) research the impacts of climate change on agro-ecosystems over this century from 1990 up to 2080 at the global level with a significant regional detail. An integrated ecological-economic modeling framework is used which encompasses climate scenarios, agro-ecological zoning information, socio-economic drivers and food trade dynamics. Additionally, global simulations are performed using the Food and Agriculture Organization/International Institute for Applied Systems Analysis (FAO/IIASA) agro-ecological zone model, in conjunction with IIASAs global food system model, using climate variables from five different general circulation models, under four different socio-economic scenarios from the intergovernmental panel on climate change. This modeling approach connects the relevant bio-physical and socio-economic variables within a unified and coherent framework to produce a global assessment of food production and security under climate change. Empirical results suggest that critical impact asymmetries due to both climate and socio-economic structures may deepen current production and consumption gaps between the developed and developing worlds. It is suggested that adaptation of agricultural techniques will be central to limit potential damages under climate change. The impact of natural disasters on international trade is analyzed by Gassebner et al, (2006). They investigated the impact of major disasters on international trade flows for more than 170 countries for the years 1962-2004. Results indicate that the driving forces determining the impact of such events are the level of democracy and the area of the affected country. The less democratic and the smaller a country, the more reduced its trade flows are when struck by a disaster. In addition, they distinguish the effect of a disaster on an importing and an exporting country. Global warming cannot be considered a disaster although it causes many abnormal natural events like floods and droughts. Rather, it is a macro look at natural abnormalities. By examining the impacts of global warming on international trade this paper can help to establish a stance in the effort to locate the possible influences of climate change.
In short, based on the literature review, most of the studies cover the impacts of global warming on agriculture, mainly specific agricultural production. The general conclusion is that if countries or unions cannot take protective actions against global warming, agricultural production will decrease and in some parts of the world like Africa, food scarcity will be felt more frequently. Global warming is a threat that can change the balances of international trade. Thus, these imbalances are also a threat to human health and security.
Turkey is also aware of the pending danger of global warming and there are many subsidies and enforcements in place to control the climate related problems and to prepare for possible environmental changes. Turkey supports renewable energy resources and clean energy mechanisms (Yamanoglu, 2006). In addition, there are financial incentives for investment and government supported credit to investors of renewable energy sources. Moreover, there are tax incentives such as customs tax exemptions, which also encourage the investors. Many studies investigate the environmental effects of global warming and regulatory mechanism system. Telli, Voyvoda and Yeldan (2007) develop a computable general equilibrium model for Turkey to analyze the economic impacts of the intended policy scenarios in compliance with the Kyoto Protocol and environmental abatement policies for 10 production sectors in Turkey over the period 2006–2020. They discuss the economic evaluation of sector based emission reduction policies for climate change. Results suggest that the challenge of imposing emission control targets and the implied declining costs could be quite high, and that there is a need to finance the expanded abatement investments in the face of scarce domestic resources. The empirical studies for emerging countries, especially for Turkey are rare and also mainly related to the environmental sciences. Therefore, it is worth studying the impact of climate change on the agricultural trade capability of a group of emerging and developed countries in the European food market. There are no specific studies which investigate agricultural production and/or trade, international trade and climate change simultaneously.
Data and Methodology
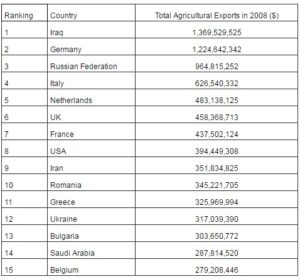
The major 15 food export markets of Turkey are Iraq, Germany, Russian Federation, Italy, the Netherlands, the UK, France, the USA, Iran, Romania, Greece, Ukraine, Bulgaria, Saudi Arabia and Belgium for the year 2008 according to the data retrieved from Exporters’ Assembly of Turkey (Table 4).
Table 4: Major 15 Food Markets of Turkey in the Year of 2008 ($)
Source: Exporters’ Assembly of Turkey (http://www.tim.org.tr)
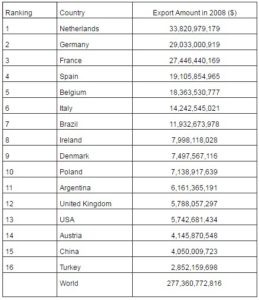
After determining the major food markets of Turkey, European countries are chosen as the “food export market” because of proximity, high share of the EU in total trade volume of the world as well as Turkey and high purchasing power in contrast to the other countries. In addition, ten of these countries are located in Europe. Germany, Italy, the Netherlands, the UK, France, Romania, Greece, Ukraine, Bulgaria and Belgium. After reaching the major European food export markets of Turkey, the most competitive countries in these markets have been examined. Major food exporters to these ten European countries are verified in the United Nations Database. Therefore, the sample set in the study includes the major exporters to these ten European food markets (Table 5).
Table 5: Major Rivals of Turkey in European Food Export Markets
Source: United Nations Database (http://comtrade.un.org/db)
Major rivals of Turkey in European food export market are the Netherlands, Germany, France, Spain, Belgium, Italy, Brazil, Ireland, Denmark, Poland, Argentina, the UK, the USA, Austria and China. Turkey ranks the 16th. Panel data in the study cover these 16 countries for the period of 1990-2008. The data is retrieved from the World Bank and United Nations. Agricultural exports of a country depend on many internal and external factors such as exchange rate, price, level of output, tariffs and etc. In this study, the basic model of Weeks (Gingrich and Garber, 2010) is adjusted to estimate on the effect of climate change on agricultural trade capability of Turkey and as well as the rivals’ of Turkey in the European food market besides the traditional and non-traditional determinants in the literature.
The dependent and independent variables are defined as follows:
- AGT : net agricultural exports relative to total agricultural output in year t
- RER : the real exchange rate, measured in local currency unit per US$ in year t
- RPAM : the ratio of agricultural to non-agricultural prices in year t
- SHGDP : the share of agricultural output in total output in year t
- ARL : the arable land available in year t
- FDI : the foreign direct investments (net inflows) in year t
- POP : population in year t
- AGM : Agricultural machinery (tractors per 100 sq. km of arable land) in year t
- PED : Particulate emissions damage in year t (willingness to pay to avoid mortality attributable to particulate emissions) (US$)
- CO2 : Carbon dioxide emission in year t (kt)
- CO2I : CO2 intensity in year t (kg per kg of oil equivalent energy use)
The dependent variable is the net agricultural trade balance calculated by exports- imports, divided by agricultural output (AGT). One of the traditional determinants for agricultural trade is the Real Exchange Rate (RER). The RER is calculated by official exchange rate divided by GDP deflator. If real exchange rate appreciates, agricultural exports become less competitive at international markets. Therefore, the expected sign for real exchange rate is negative. The second traditional independent variable is ratio of agricultural prices to non-agricultural prices (RPAM). A rise in prices of agricultural products may stimulate more agricultural production and agricultural exports. On the other hand, high export prices may lead to fewer exports. Therefore, the sign of this independent variable is ambiguous. The third independent variable is the share of agricultural output in total output (SHGDP). The share of agricultural production in total GDP may have a positive impact on net agricultural trade.
In order to see the impact of agricultural production capability, arable land (ARL), net inflows of foreign direct investment (FDI), population (POP) and agricultural machinery (AGM) are included as agricultural production capability factors in the model. The arable land (ARL) is measured in hectares and the size of the ARL is directly related to the agricultural production capacity of a country. If the ARL increases, agricultural production and agricultural export increase, consequently the sign of the ARL variable is expected to be positive. However, the size of the ARL is expected to diminish due to climate change. Climate change can alter the size and quality of arable land due to change in precipitation levels and natural disasters such as droughts or floods. Supply of water which is a major input for irrigation can also be affected negatively because of global warming. On the other hand, climate change may increase the availability of arable lands and water resources in some parts of the world where the regions mainly consist of swamps. Therefore, the sign of this variable may become ambiguous. Net inflows of FDI are also taken into account as an independent variable. FDI inflows usually address the service sector and the industrial sector, especially in the manufacturing industry. Consequently, FDI may influence agricultural trade in a negative manner. POP is a variable which shows the level of potential demand domestically. If a country has high population, there will be more domestic consumption of agricultural products and less agricultural products available to be exported. Hence a negative sign is expected for population variable. AGM is included in the adjusted model and it is defined as tractors per 100 sq. km of the ARL. The influence of this independent variable on agricultural trade balance is expected as positive since technological improvements have a positive effect on production. However, the negative influence of this variable may arise due to use of gasoline, leading air pollution and air pollution (caused mainly by carbon dioxide and carbon monoxide emission gases) and availability of land and water. So, the expected sign is ambiguous.
The effect of climate change on agricultural trade can be captured by emission indicators such as particulate emission damage (PED), carbon dioxide emission (CO2) and carbon dioxide intensity (CO2I) in the adjusted model. Emission is a common tool used all over the world to define the pollution ratio of the air. World Bank’s indicator for emission is defined as particulate emission damage (PED) and is stated in dollars. It describes the willingness to pay to avoid mortality attributable to particulate emissions in a country. In order to observe the impact of emission in value on the agricultural trade balance, this specific indicator of World Bank is included in the model. An expected relation between emission damage and agricultural trade is negative. However, particulate emission damage may show that countries do not care about the emission that they release into the environment through their usage of energy sources such as oil and coal if it means an increase in their industrial production. As a result of this situation, if the industrial developments are in favor of agricultural production, they may have a positive influence too on the agricultural trade capability of countries. Therefore, the expected sign of the variable becomes ambiguous.
The last two independent variables of the model are directly related to the impact of greenhouse gas emissions. The variables are selected as CO2 and CO2I. World Bank describes CO2 in kilo tones (kt) and CO2 intensity as kg per kg of oil equivalent energy use. As mentioned above, emission gases are generally unfavorable for agricultural production and the competitive power of the countries in the food market. There are two side effects of GHG: (1) 14% of greenhouse gas in the world is derived from agriculture, so that agricultural output may accelerate GHG. (2) The efficiency of agricultural products and the cost of production are influenced by the temperature, precipitation and the amount of carbon dioxide in the atmosphere, so that the negative impact of climate change can affect harvest time and efficiency of agricultural products. Therefore, the expected sign of these two independent variables is ambiguous.
The effect of climate change on the agricultural trade capability of Turkey and its major rivals in the European food markets is analyzed by Panel Data Models (Green, 1997). Two versions of the panel data models are considered in this study: Ordinary Least Square (OLS) and Fixed Effects Model (FEM). Two versions of the model are estimated for two groups: (1) the period of 1990-2008 is analyzed for all the countries in the sample, (2) the period 1990-2008 is tested by dividing countries into two groups as emerging markets and developed markets. Since the economic development levels and structure of the economies are different in the sample, it is better to disaggregate the sample. NLOGIT has been used in computing the regression analyses.
Green (1997) describes panel data procedures as the simultaneous investigation of a system of equations that consider both country specific characteristics and change over time. FEM assumes that the effects of the numerous omitted individual time varying variables are individually unimportant but are collectively significant where  t is a classical disturbance with
 and
and  . The individual effects can be absorbed into the intercept term of a regression model as a means to explicitly allow for individual or time heterogeneity in the temporal cross-sectional data.
 Thus is a separate constant term for each unit that varies both cross-sectional across countries and over time. The problem of multicollinearity is avoided by imposing the following restriction,
Empirical Findings and Policy Implications
The effect of climate change on the agricultural trade capability of Turkey and its major rivals in the European food market are evaluated for the pooled data and for separate grouping of economies as emerging and DCs. The econometric models that are utilized in this study are OLS, FEM and Random Effects Model (REM) to analyze the following hypotheses.
- Hypothesis 1: Traditional factors are important determinants for agricultural trade capability of the major exporters in the European food market.
- Hypothesis 2: Agricultural production infrastructure has a positive effect on agricultural trade capability of the major exporters in the European food market.
- Hypothesis 3: Climate change has a negative impact on agricultural trade.
- Hypothesis 4: Agricultural trade capability does not differ for the emerging and developed countries in the European food market.
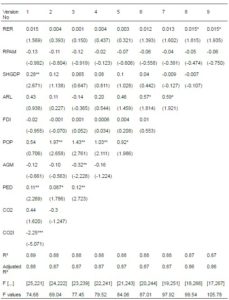
Nine versions of these models are run separately with different explanatory variables to determine the best identification. So the sensitivity analysis should also provide an insight for this period empirically. The Hausman test is used to test the performance of OLS and FEM. The Lagrange Multiplier (LM) test is used to test the performance of REM against OLS with no individual country effects. LM test results favor OLS over REM model and the Hausman test favors FEM against REM. Therefore, the FEM results are presented. The Hausman statistics favors FEM. FEM assumes that the intercept changes across countries and this term captures country specific characteristics, such as differences in economic development levels, technological infrastructure, standard and regulations in the agricultural sector. Nine versions of FEM are estimated for the pooled data and presented in Table 6.
Table 6: Estimates of Fixed Effects Model – Pooled Data
Dependent variable is the net agricultural exports relative to total agricultural output
Figure in parentheses are t statistics, *** Significant at the 1% level, ** Significant at the 5% level, Significant at the 10% level
R² and adjusted R², 0.89 and 0.88 respectively, improves significantly when they are compared to 0.64 in OLS. The explanatory power of FEM rises when country specific effects are taken into account in FEM. However the R² in the rest of the versions does not improve. Therefore, the first version of the model can be accepted as the base model. In addition, F values are very high compared to F table value. Therefore, the null hypothesis of ‘independent variables have no explanatory power’ is rejected at the 1% significance level.
The coefficients measure the magnitude of the effect coming from independent variables on agricultural trade capability. The impact of RER on agricultural trade is generally insignificant and positive in all nine versions of FEM.. However, the magnitude of RER is relatively low. The coefficient of ratio of agricultural to non-agricultural prices (RPAM) is negative and statistically insignificant. Based on the FEM results, it can be concluded that competitiveness in agricultural goods deteriorates as the domestic relative price of agricultural to non-agricultural products rise. The share of agricultural output in total output (SHGDP) has the expected sign (positive) and is statistically significant at 5% level in the base model. It states that a 1% increase in share of agricultural output in total output can lead to a 0.28% increase in agricultural trade.
The coefficient of the ARL has the expected sign but statistically insignificant in the base model. The effect of FDI on agricultural trade capability exhibits inconsistent results in terms of sign but the magnitude of this negative impact is small and insignificant. Population (POP) is positive but statistically insignificant in the base model. Yet, it is significant in other versions of FEM. It indicates that domestic consumption dominates and lowers amount available for export in agricultural sector. The variable of AGM is defined as tractors per 100 sq. km of arable land and taken into account as indicator for technological infrastructure in agricultural sector. However, the coefficient has a negative sign and is insignificant in the base model.
In order to capture the impact of climate change on agricultural trade capability, three different emission indicators are considered. PED is included to see the impact of avoiding negative effects of climate change. Since PED can be described as the willingness to pay to avoid mortality attributable to particulate emissions in each country, the positive relation between PED and agricultural trade implicitly states that the countries with high GHG emissions have higher agricultural trade levels. On the other hand, it also indicates that some countries are ignorant about paying the monetary cost to compensate particulate emissions. The second variable for emission is CO2 emission and it has a positive sign in the base model, indicating that countries with higher level of agricultural trade have higher emission levels. It is worth remembering that 17% of GHG emission is derived from agricultural production. Higher CO2 emission leads to higher agricultural production and finally, higher agricultural trade balance. The last climate change variable is the CO2I and measured as kg per kg of oil equivalent energy use. The sign of the coefficient is negative and the magnitude of CO2I is striking. A 1% increase in CO2I causes a 2.3% decline in agricultural trade capability. It can be interpreted as agricultural trade capability declines when the emission intensity level of the country increases. This variable has been described and calculated by the World Bank and basically shows the level of the pollution derived from different energy sources like coal. Carbon dioxide intensity is respectively higher in the countries where coal or any different energy source usage is higher. For instance, the highest carbon dioxide intensity in 2008 belongs to China and China has one of the major negative influences on agricultural trade capability with respect to carbon dioxide intensity.
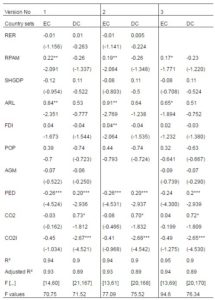
Since the FEM results capture country specific characteristics better and explain the impact of different variables on agricultural trade capability better for the given sample, it is worth disaggregating the sample set as DCs and emerging markets. The sensitivity analyses for different country groups are also considered for the same period. Table 7 presents the empirical results which categorize the countries as emerging and DCs. Emerging countries are Turkey, Brazil, China, Argentina and Poland whereas DCs are the other eleven countries: the Netherlands, Germany, France, Spain, Belgium, Italy, Ireland, Denmark, the UK, the USA and Austria. After categorization of countries, FEM is applied as three different versions.
Table 7: Estimates of Fixed Effects Model – Disaggregated Data
Dependent variable is the net agricultural exports relative to total agricultural output
Figure in parentheses are t statistics,*** Significant at the 1% level, ** Significant at the 5% level, *Significant at the 10% level
In the first versions of models all the variables have been included. In the second version of the models, one of the independent variables; AGM has been excluded since the expected sign of this variable mostly resulted in the opposite in the pooled version. Moreover, in the third version, RER is not included in the model. However, in all of the versions of the OLS model, results showed that this variable affects the dependent variable in a positive trend and is also significant in seven of the versions. The explanatory power of the FEM with all variables version 1 is around 0.90 for emerging countries and 0.68 for DCs, indicating that the independent variables are better capable of explaining the changes in agricultural trade capability for both emerging and DCs after disaggregation.
The noticeable difference is that the impact of RER, RPAM, SHGDP and PED on agricultural trade capability is positive for DCs but negative for ECs. However, the magnitude of RER is relatively low. RPAM is statistically significant for DCs in all versions. The coefficient of ratio of agricultural to non-agricultural prices (RPAM) is positive and statistically significant at the 5% and 10% level for the emerging markets while it is positive and statistically insignificant for the DCs. It can be interpreted as emerging countries’ willingness to export agricultural products does not rise as agricultural prices increase. Since the population of emerging countries are relatively high (population of the emerging countries in the sample is equal to 1.7 billion, however population of DCs are 660 million), prices of agricultural products are insignificant since domestic consumption levels are higher. The SHGDP has the expected sign (positive) for the DCs but is statistically insignificant. It can be interpreted as 1% increase in share of agricultural output in total output can lead to a 0.11% increase in net agricultural trade. The sign of the share of agricultural output in GDP is negative for emerging markets in all versions of FEM. The dependent variable, net agricultural trade balance (AGT) is calculated as agricultural exports-agricultural imports divided by agricultural output. When the conditions of each economy are taken into consideration, an increase in agricultural output may lead to a decrease in the AGT if the food trade balance remains the same for the countries. Higher population levels lead in somehow higher production but also higher domestic consumption. For instance, the SHGDP levels of China, Turkey, Argentina, Brazil and Poland are 11.31%, 8.65%, 9.84%, 6.70% and 4.51%, respectively. All the SHGDP ratios of these emerging countries are above the ratios of the DCs.
The coefficient of the ARL is positive as expected for ECs and DCs. In emerging countries, the expectations for all three versions are statistically significant at all levels whereas statistically insignificant in the DCs, indicating that agricultural productivity of the DCs in the sample is comparatively high with respect to their size of arable lands. FDI has a positive effect contrary to the expectation of agricultural trade for the emerging countries and statistically significant when agricultural machinery has been excluded from the model at 5% significance level. It can be interpreted that FDI inflows might improve the technological possibilities that may accelerate the agricultural production in the emerging markets. However, its impact is relatively low. The coefficient of POP is negative and insignificant for DCs where most of the population is employed in the service and industry sectors. However, coefficient of population is positive but still insignificant for ECs where most of the population works in the agricultural sector. Population has an effect on domestic agricultural consumption on the other hand: it is an input for agricultural production in ECs. The variable of AGM still has a negative sign and is insignificant for version 1 and 3, and has not changed after taking into account country specific characteristics. When agricultural machinery has been excluded in version 2, explanatory power of the variables has not changed significantly.
Three different emission indicators are considered. PED has a negative and significant coefficient for ECs. On the other hand, coefficient is positive for DCs. It can be interpreted as 1% increase in particulate emission damage can lead to a 0.26% decrease in net agricultural trade capability of ECs. The reason behind this finding could be that particulate emission damage of emerging markets is growing for emerging countries especially for China, Turkey and Poland in the 2000s. On the other hand, this particulate emission damage is decreasing for the DCs. This conclusion shows that the effect of particulate emission damage on agricultural trade capability is negative in emerging markets since there is not enough policy to handle the threat of global warming, however decreasing levels of particulate emission damage in DCs has a positive impact on agricultural trade capability. The second variable for emission is CO2 emission and it has a positive sign for 3 versions of OLS model for both the emerging and DCs, indicating that countries with higher level of agricultural trade have higher emission levels. The coefficient of CO2 is statistically significant at 10% level for the DCs. Carbon dioxide emission is related to agricultural production (%17 of GHG emission is derived from agricultural production). A higher CO2 emission leads to higher agricultural production and finally, higher agricultural trade balance. The countries stated in the model are also the leaders in the food export market of Europe. However, the magnitudes of coefficients for CO2 in emerging countries are insignificant and respectively low. The reason for the difference could be due to the low level of agricultural production level in ECs in contrast to the DCs. There are 5 ECs whereas there are eleven DCs including the USA. Third is the CO2I. The sign of the coefficient is negative and it is statistically significant at 1% level for DCs in all versions of FEM. Results show that kg per kg of oil equivalent energy use is higher in ECs.
Conclusion
As the average temperature of the Earth continues to increase as a result of increasing greenhouse gas emissions sent to the atmosphere, many regions will face different climatic changes and environmental impacts. Consequently, global warming and global food security issues will continue to be at the center of policy debates as climatic trends continue for the rest of the century. Agriculture is one of the sectors that is most affected by climate change. However, there are conflicting hypotheses regarding the relation between climate change and agricultural production, and agricultural trade as well, in the literature. Unfavorable weather conditions may cause water scarcity, unstable rainfall and increase in temperatures, resulting in lower efficiency in animal and agricultural production and agricultural trade capability of the countries. The aim of this study is to determine the effect of climate change on the agricultural trade capability of Turkey and its major rivals in the European food market. The main hypothesis is that variables of climate change have a negative effect on the agricultural trade capability of Turkey and its rivals for the period of 1990-2008. Panel data models are employed to analyze main determinants of agricultural trade for 16 countries for the period of 1990-2008.
The empirical evidence supports the idea that climate change affects the agricultural trade capability of Turkey and the major comparative emerging and developing countries. Empirical results for both periods reveal that FEM outperform OLS and REM for the given sample set. The impact of climate change on agricultural trade capability is overestimated when the country’s specific effects are not taken into account. The empirical findings of FEM reveal that particulate emission damage and carbon dioxide emission diminish the agricultural trade capability in the emerging countries, Turkey, China, Brazil, Argentina and Poland. Therefore, these emerging countries have to deal with global warming in order not to lose a competitive power in the European food market and channel industrial innovative techniques and developments to control carbon dioxide emission in the agricultural sector. Industrial development polices should support agricultural production as well as the industrial sectors. Carbon dioxide intensity supports the hypotheses that agricultural trade capability of the emerging and DCs have been influenced negatively by climate change. Intensity includes fossil energy sources like coal and becomes unfavorable for the agricultural trade capability of both the emerging and DCs.
Empirical findings may refer to some policy implications for emerging countries in the upcoming years. They should invest in renewable energy sources; channel industrial and technological developments to the agricultural sector; implement strong control mechanism for speculative actions of food prices in order not to lose a competitive power in European food markets; take proper and timely actions to minimize the negative effects of climate change for the scenarios of the International Panel on Climate Change; and put into action trade and support policies in order not to lose a competitive power in agricultural production and trade in the future.
(adsbygoogle = window.adsbygoogle || []).push({});
References
Copeland, B. R. & Taylor, M. S. (2001). “Free Trade and Global Warming: A Trade Theory View of the Kyoto Protocol,” Retrieved October 27, 2008 from emlab.berkeley.edu/~obstfeld/e281_sp02/Taylor.pdf
Publisher – Google Scholar
Dellal, I. & Butt, T. (2005) İklim değişikliği ve Tarım [Climate Change and Agriculture], TEAE publications, TEAE-View, Ankara. Retrieved January 20, 2009, from www.igeme.org.tr/bakis/Bakis_36/syf103-111.pdf
Dellal, I. & McCarl, B. (2007). ‘Agriculture in the Climate Change and Energy Squeeze: Effects, Adaptation and Mitigation,’ International Conference on Climate Change and Environmental Effects, KOSKI, Konya.
Google Scholar
European Commission. (200). ‘Leading Global Action to 2020 and Beyond,’ EU Action against Climate Change 2008 Edition. Retrieved December 22, 2008 from ec.europa.eu/environment/climate/campaign
Faris, S. (2007). “The Real Roots of Darfur,” Atlantic Magazine. Retrieved July 26, 2010, from www.theatlantic.com/magazine/archive/2007/04/the-real-roots-of-darfur/5701.
Publisher – Google Scholar – British Library Direct
Fischer, G., Shah, M. , Tubiello, F.N. & Velhuizen, H. V. (2005). “Socio-economic and Climate Change Impacts on Agriculture: An Integrated Assessment, 1990-2080,” Philosophical Transactions, The Royal Society. B, 360, 2067-2073, doi:10.1098/rstb.2005.1744.
Publisher – Google Scholar – British Library Direct
Gassebner, M., Keck A. & Teh, R. (2006). “Impact of Disasters on International Trade,” WTO Economic Research and Statistics division. Retrieved October 22, 2008, from www.wto.org.
Publisher – Google Scholar
Greene, W.H. (1997). Econometric Analysis, 3rd edition. New Jersey: Prentice Hall International.
IPCC (2007). ‘Climate Change 2007: Synthesis Report,’ Retrieved October 15, 2008 www.ipcc.ch/ipccreports/index.htm
Google Scholar
Parry, M. L., Rosenzweig, C., Iglesias, A., Livermore, M. & Fischer, G. (2004). “Effects of Climate Change on Global
Food Production under SRES Emissions and Socio-Economic Scenarios,” Global Environmental Change 53-67. Retrieved October 20, 2008, from www.sciencedirect.com.
Publisher – Google Scholar
Romar, J. E. (2009). “Snapshots of the Future: Darfur, Katrina, and Maple Sugar. (Climate Change, the Less Well-Off and Business Ethics),” Journal of Business Ethics 85, 121-132. Retrieved April 2, 2009, from www.springerlink.com/content/9nt7855003l20828.
Publisher – Google Scholar
Seo, N., Mendelsohn, R. O., Kurukulasuriya, P., Dinar, A. & Hassan, R. M. (2008). “Differential Adaptation Strategies to Climate Change in African Cropland by Agro-Ecological Zones,” World Bank Policy Research Working Paper Retrieved October 23, 2008a, from www.worldbank.org.
Publisher – Google Scholar
Seo N., Mendelsohn R., Kurukulasuriya, P., Dinar A. & Hassan, R. (2008). “A Ricardian Analysis of the Distribution of Climate Change Impacts on Agriculture across Agro-Ecological Zones in Africa,” World Bank Policy Research Working Paper Retrieved October 23, 2008b, from www.worldbank.org.
Publisher – Google Scholar
Slater, R., Peskett, L., Ludi, E. & Brown, D. (2007). “Climate Change, Agricultural Policy and Poverty Reduction – How Much Do We Know?,” Overseas Development Institute, 1-6. Retrieved October 29, 2008, from www.odi.org.uk/climatechange/.
Publisher – Google Scholar
Telli, C., Voyvoda, E. & Yeldan, E. (2007). “Economics of Environmental Policy in Turkey: A General Equilibrium Investigation of the Economic Evaluation of Sectoral Emission Reduction Policies for Climate Change,” Journal of Policy Modeling 321-340. Retrieved October 20, 2008, from www.sciencedirect.com
Publisher – Google Scholar
The World Trade Organization. (2000). ‘WTO Negotiations on Agriculture,’ Committee on agricultural special session. Retrieved October 22, 2008, from www.wto.org
Tubiello, F. N. & Fischer, G. (2007). “Reducing Climate Change Impacts on Agriculture: Global and Regional Effects of Mitigation, 2000–2080,” Technological Forecasting & Social Change, 74 1030-1056. Retrieved October 20, 2008, from www.sciencedirect.com
Publisher – Google Scholar
Yamanoglu, G. C. (2006). ‘Türkiye’de Küresel ısınmaya yol açan sera gazı emisyonlarındaki artış ile mücadelede iktisadi araçların rolü [The role of financial instruments through challenging against the increasing of GHG emissions which cause global warming in Turkey],’ MA thesis, University of Ankara.
Google Scholar
Appendix:
Table 1A: Food Exports in the World from 1985 to 2008 (billion $)
please click on the image to see full Table
Source: World Bank database
Table 2A: Food Imports in the World from 1985 to 2008 (billion $)
please click on the image to see full Table
Source: World Bank database


