Introduction
Building has been a sustainable sector since ancient times. Both materials and building techniques represented efficient construction, featuring ecologically designed buildings and eco-friendly materials with high reusability and recyclability. This model of construction was circular. However, the adoption of more resilient and durable building materials during the 20th century converted the sector into one of the most environmentally harmful, unsustainable and waste-generating industries in the world.
Fortunately, businesses worldwide have started to express increasing concern about environmental issues. In this context, the building sector, being one of the larger emitters of harmful gases, generators of waste, and consumers of resources (Esa, Halog and Rigamonti, 2017), plays a relevant role. The main causes of the building sector’s environmental impact are found in the consumption of non-renewable resources and the generation of contaminant residues, both of which are increasing at an accelerating pace. The sector’s primary effect is the accelerated destruction of the stock of natural capital (Wadel, Avellaneda and Cuchí, 2010; Lo Presti, 2013).
Modern materials, which are useful for construction and which enable excellent building features, have the side effect of dramatically increasing the building sector’s environmental impact. Furthermore, the maintenance phase that follows a construction also has a significant environmental footprint. It is also necessary to focus on deconstruction, which is a key aspect for minimizing waste, so as to create more effective strategies (Esa, Halog and Rigamonti, 2017). Furthermore, the reuse of elements (e.g., parts of buildings) requires deep consideration of their quality, their usefulness in terms of dimensions (do they fit the new place?) and marketing issues (do people want to buy used materials?).
For these reasons, the Circular economy (CE) can be presented as a business model of sustainability that is especially useful in the building sector, so it is necessary to create a specific framework for this business model, providing answers to questions about how to implement the CE in the building industry. However, there is a lack of circularity indicators that would allow us to measure the circularity thinking in the enterprises. Lewandowski’s (2016) literature review on the CE reveals only eight references which were focused on evaluation models, some of which analyzed a scale of measurement of the CE. Besides, the indicators introduced by other works such as that of Lihong and Hui (2011) are generic, considering, e.g., emission levels or energy consumption. This scarcity of scales is acting as an obstacle to the development of the Circular economy in construction companies. This research was aimed to create a measurement model of circularity thinking in the building sector based on a set of indicators which would allow businesses to manage the degree of implementation of the CE, collecting information from the project life cycle.
Therefore, the main contribution of this paper is a CE measurement scale specifically designed for construction projects. It will be a useful method to evaluate the degree of implementation of CE, generating valuable information not only for the company (contractor), but also for other project stakeholders. This can be a step towards developing CE which is really useful in practice.
Theoretical Framework
Industrial Ecology theory as the base of Circular economy in building sector
Ecology is concerned as ‘creation, use, and management of resources for the adaption, human development, and sustainability of environments’ (Bubolz and Sontag, 1993), focusing on the interactions between humans (individuals, groups, and society) and the environment. The entire system comprises the cultural norms and beliefs that influence the other systems, which represent the framework for legislative changes. An ecological transition occurs whenever a person’s position in the ecological environment is altered as the result of a change in role, setting or both (Bronfenbrenner, 1979; Bauer and Dolan, 2011).
This view is enriched and focused on the industry through industrial ecology theory, a new framework that is useful to describe sustainable building which pays attention to designs, flows derived from the building process, energies used, and outputs generated (Boons et al., 2017). The main assumptions of this theory are (Ehrenfeld, 1997) as follows. First, the Earth is configured as a closed ecological system in which the scale and design of development are inconsistent with long-term ecological survival. Second, human society and natural ecosystems have co-evolved; thus, nature has now an intrinsic value, and the ethical and moral underpinnings of economic actions overlook concerns for the world. Third, sustainability means independently maintaining stocks of human and natural capital. Fourth, policy strategy focuses on several issues, such as economy based on functionality, moral and ethical transformation, technological realism, precautionary management of uncertainty, and the life cycle framework, all of which are useful for closing material loops in deconstruction (Kibert, 2007; Silvestre, De Brito and Pinheiro, 2014).
Tibbs (1993) articulated a framework for industrial ecology that was adapted to the building sector. Thus, industrial ecology is a strategic framework that can be used as a guide for the development of building practices. In the concept, the impacts of the design phase play a key role, guiding the flow of materials in and out of the environment (Hao et al., 2017). It is crucial to consider buildings in their whole life cycle. According to Lenox and Ehrenfeld (1997), the first phase of design is a conscious, explicit activity to establish new forms of technology, organizational or industrial structures, human competence, and rules. The design must be the starting point that allows the implementation of the CE in the building sector. Moreover, the current building misdirection is quite clear so the implementation of this new economic model based on circularity has to be done by generating a framework useful for practitioners. Thus, four paths are useful through which the CE can be applied to the building design process, based on the model of Tibbs (1993) and Ehrenfeld (1997). First path is to improve the current metabolic pathway of building processes and material used. The second one involves the need to implement the principles of CE in the industrial ecosystem. Third path dematerializes building output, keeping in mind the idea of the product as a service, Cradle to Cradle (McDonough et al., 2003; Mulhall and Braungart, 2010; Van Dijk, Tenpierik and Van Den Dobbelsteen, 2014), and managing resources carefully. The last one systematizes the pattern of energy used (Braungart, McDonough and Bollinger, 2007).
Building sector in Europe and Circular Economy
The building sector in Europe is strategic for the economies of the most European countries. In 2014, 1,545,460 million euros were invoiced, generating employment for 12,730,700 people1.
Europe’s building industry is highly fragmented and often local, possibly because of each country’s legal restrictions. Because of the high inflow of physical goods and personal interaction, the employment ratio in the building industry has remained relatively stable in the various states of the European Union (EU). It usually ranges from 4.5% to 6.5% of total employment.
Currently, the amount of waste generated in the EU appears to have declined: approximately 2.5 billion tonnes of waste (or approximately 5 tonnes per capita) continue to be generated each year (according to: http://www.europarl.europa.eu/RegData/etudes/BRIE/2016/573899/EPRS_BRI(2016)573899_EN.pdf). Some EU members generate significant amounts of recyclable waste in the building sector (the Netherlands, Germany, France, Italy), whereas other countries’ recycling share is lower. Figure 1 shows the total waste generation in European countries in 2014 according to Eurostat, Figure 2 shows waste generation decomposed by sector, and figure 3 the level of recycling.
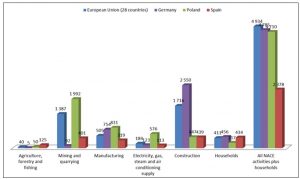
Fig. 1: Generation of total waste in Europe in kilograms per capita (2014)
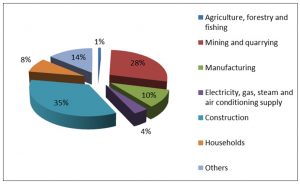
Fig. 2: Breakdown of total waste generated in European Union in 2014 by sector
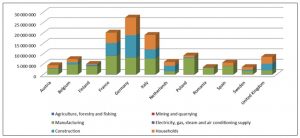
Fig. 3: Generation of recyclable waste by sector in Europe in 2014
Building sector is characterized by both its intensive energy and water consumption and its generation of negative externalities in the form of environmental pollution. The sector itself is aware that it must change its management model to become more sustainable and that it can comply with the new approach to the ‘sustainable use of resources’ set out in the European Building Products Regulations, which have been in force since 2013 and state that products’ environmental declarations should be used when assessing the sustainable use of resources and the environmental impact of building works.
In addition, the EU is considering initiatives to the use of environmental variables as factors as a basis for establishing public procurement criteria. It is worth noting the EPD (Environmental Product Declaration) methodology, whose purpose is to provide quantitative information about a product or service’s environmental impacts throughout its life cycle. In addition, the initiative regarding products’ environmental footprint (PEF) attempts to raise awareness and value the environmental impact of the inputs that are incorporated into the production or building process. Thus, taking all of this into account, the sector must consider the transition and progressive incorporation of the new paradigm of the CE, approved by the European Commission, which determines, not only the efficient use of resources in environmental terms, but also the minimization of resources that are consumed, reincorporating them into a new productive or other type of process in which they are considered a productive factor. In this way, the building industry will contribute to a cyclical process in which product life will be as long as possible.
Building Life Cycle Based Assessment Model of Circularity Thinking Scale
Scale Inputs
In order to have the initial indicators of the scale, a systematic review of the literature has been carried out, whose purpose has been to obtain a complete view of the existing research on the subject. In this paper, the research that has been done so far was presented after having used explicit methods to narrow the search and to evaluate in a critical and justified way each of the related studies (Vázquez and López, 2011). The basic criterion is to show valid and applicable evidence for future research. The review should be methodological, transparent and reproducible with the aim of enhancing the knowledge base to make appropriate decisions (Tranfield, Denyer and Smart, 2003).
Review is a fundamental scientific activity and its logic is based on several premises. The first is that the large amount of existing information should be reduced to smaller, more manageable units to facilitate their understanding and management. In this way it will be possible to effectively use the previous scientific evidence, identifying key works and future lines of research. The second is that the review should show evidence of the process developed, it should be auditable and repeatable so that other researchers who follow the search and analysis guidelines can perform comparable work, avoiding search bias and analysis, and the third is that the review should summarize the evidence (Tranfield, Denyer and Smart, 2003; Rousseau, Manning and Denyer, 2008).
The research was based on the approaches of Vázquez and López (2011), and Nuñez-Cacho et al. (2012) defining the aspects to be investigated, developing subsequently the search in the bibliographic databases, i.a. ProQuest, limiting the results to a sample that includes the main journals in the study area, specifically, based on the search terms: “Building”, “Circular Economy”, “Measurement Scale”. A list of researched journals appears in the references section. Moreover, each author analysed the content of each of the selected articles in order to identify the indicators that were to be introduced. It has to be underlined that in the research, professional experts responsible for construction projects were involved. They were responsible i.a. with the authors for choosing the circularity indicators and for estimating parameters used in the simulation model. The selected indicator group was classified according to the Life Cycle Model. The selected indicators and their desired value are shown in table 1, 2 and 3.
Table 1: Circular economy indicators in the construction sector: Organizational level
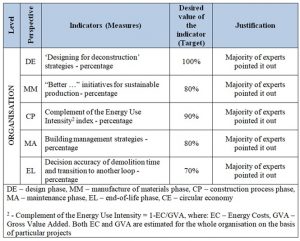
Table 2: Circular economy indicators in the construction sector: Process level
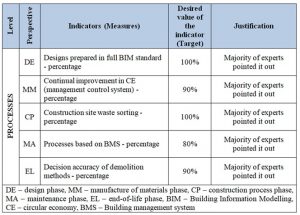
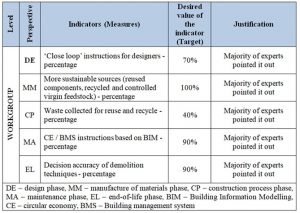
Table 3: Circular economy indicators in the construction sector: Workgroup level
Method: Deterministic Calculation
The environmental impacts of building are primarily evaluated on the basis of the life cycle assessment, which enables the examination of all stages in the product life cycle (Jiménez Rivero, Sathre and García Navarro, 2016; Shadram et al., 2016; Nasir et al., 2017). A theoretical framework for waste minimization using the concept of the CE in the life cycle of the projects has been proposed (Esa, Halog and Rigamonti, 2017), which observes the main principles of Industrial Ecology.
A sustainable life cycle consists of five phases: the sustainable design process; the sustainable production of sustainable materials and equipment; the sustainable building process; the sustainable maintenance; and the sustainable liquidation, meaning the conversion of outputs into the inputs of reuse, remanufacturing or recycling. These phases involve three different levels of study: organizational, meaning decisions related to planning and organizing in the company; processes, meaning decisions regarding the processes of the building; and workgroup, meaning decisions related to the worker level.
The model proposed in this paper can be useful for measuring the circularity thinking in a construction company. The following concept represents deterministic calculation of the Circular Economy Index (values: 0 – 100%) understood as a total performance of the company in terms of the CE.
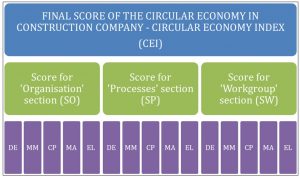
Fig. 4: Conceptual model of measuring circularity thinking in construction companies
The above figure shows a conceptual model of measuring company’s circularity thinking, which is based on the formula described by the following equation:
|
CEI = Arithmetic mean (SO;SP;SW) = Arithmetic mean (Weighted arithmetic mean(SO_DE;SO_MM;SO_CP;SO_MA;SO_EL);Weighted arithmetic mean(SP_DE;SP_MM;SP_CP;SP_MA;SP_EL);Weighted arithmetic mean(SW_DE;SW_MM;SW_CP;SW_MA;SW_EL))
|
(1)
|
Where:
CEI – Circular Economy Index
SO – Score for ‘Organization’ section
SP – Score for ‘Processes’ section
SW – Score for ‘Workgroup’ section
SO_DE – Score for ‘Design’ level in ‘Organization’ section
SO_MM – Score for ‘Manufacture of materials’ level in ‘Organization’ section
SO_CP – Score for ‘Construction’ level in ‘Organization’ section
SO_MA – Score for ‘Maintenance’ level in ‘Organization’ section
SO_EL – Score for ‘End-of-life’ level in ‘Organization’ section
SP_DE – Score for ‘Design’ level in ‘Processes’ section
SP_MM – Score for ‘Manufacture of materials’ level in ‘Processes’ section
SP_CP – Score for ‘Construction’ level in ‘Processes’ section
SP_MA – Score for ‘Maintenance’ level in ‘Processes’ section
SP_EL – Score for ‘End-of-life’ level in ‘Processes’ section
SW_DE – Score for ‘Design’ level in ‘Workgroup’ section
SW_MM – Score for ‘Manufacture of materials’ level in ‘Workgroup’ section
SW_CP – Score for ‘Construction’ level in ‘Workgroup’ section
SW_MA – Score for ‘Maintenance’ level in ‘Workgroup’ section
SW_EL – Score for ‘End-of-life’ level in ‘Workgroup’ section
Method: Probabilistic Estimation
This section explains the Monte Carlo simulation method used to analyse the CE in the building sector. The simulation is a powerful technique to analyse and solve complex problems. It is a technique that imitates the operation of the system of the real world that evolves over time. The simulation takes the shape of a set of suppositions about the operation of the system, expressing through mathematics the relationships between system components (Winston, 2008).
The Monte Carlo simulation is a technique that generates a random variable based on probability distributions. Because of its flexibility, most assumptions can be relaxed so that operating rules, including policies and components ageing processes, can be accounted for in the model (Zio, 2013). After defining a parametric model, saving the values begins the simulation process. Next, the iterative process is repeated thousands of times until the moment that each rank becomes a frequency distribution, allowing us to evaluate descriptive statistics such as variance, confidence, limits, and so on (Tate, 2012).
The output of the Monte Carlo simulation proposed in this paper is a probability distribution for the final result, showing a degree of the enterprise’s involvement in the CE. Monte Carlo simulations have been used to research many aspects of not only enterprises and projects (Dutra, Ribeiro and de Carvalho, 2014; Mangla, Kumar and Barua, 2014; González Dan et al., 2016) but also sustainability issues (Olaru, Şandru and Pirnea, 2014; Arnold and Yildiz, 2015; Pask et al., 2017). However, its previous applications, for example, in the field of economics, do not concentrate on the CE, particularly the construction sector. Such a possibility is discovered in this paper.
The simulations run according to the following equation:

Where:
CES – Circular Economy Scale
wi – weights of particular indicators in ‘Organization’ section
xi – set of probabilistic indicator values in ‘Organization’ section
wj – weights of particular indicators in ‘Processes’ section
xj – set of probabilistic indicator values in ‘Processes’ section
wk – weights of particular indicators in ‘Workgroup’ section
xk – set of probabilistic indicator values in ‘Workgroup’ section
n – number of sections (n=3)
The parameters xi, xj and xk are input random variables that affect the probabilistic results of the construction enterprise maturity in terms of the CE. The probability distributions of the variables and their statistical properties may be input from a database or may be specified by experts. The probability distributions, which are established for each random variable, enable simulation of the corresponding random numbers. The Circular Economy Scale (CES) is generated in subsequent iterations by values of the input variables. After each iteration, the output is different because each time a new draw is performed, the CES values gained in the simulation, after a defined number of iterations, create a random variable f.
Multiple iterations allow calculating the probability of the construction enterprise maturity in terms of the CE and thus the reliability of the deterministic estimation of this indicator. The simulations were conducted with an add-in called “@RISK” Risk Analysis Add-in for Microsoft Excel Version 7.5.1: Industrial Edition.
Results of the Simulation
The indicators were grouped into three different levels – organizational level, processes and workgroup, looking for the best indicator selected by experts and authors from the literature review, of each phase of the life cycle. The key indicators at the organizational level with their desired values are shown in Table 1, at process level in Table 2, and at work-group level in table 3.
Table 4 shows calculation results of the Circular Economy Index (CEI). In the sample case, its value is 58,78%.
Table 4: CEI calculation results
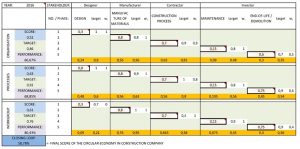
The deterministic calculation was followed by a probabilistic estimation of the Circular Economy Scale (Figure 5).
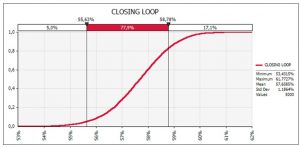
Fig. 5: Cumulative distribution of the CES after 5000 iterations
The simulations were conducted in “@RISK” during 5000 pre-set iterations. For the same case as for deterministic values, a level of 58,78% in Circular Economy Index can be reached only in 17,1% configurations what can be treated as a reliability of the deterministic estimation of the Circular Economy Index.
Discussion
The construction sector needs to undertake profound reforms to minimize its negative externalities, particularly in the areas of waste generation and resource management, which will ultimately result in a reduction in its environmental impact.
Therefore, the transition to another model of production such as the CE is not a question of social responsibility alone, but instead has become a strategic factor that guarantees the company’s future continuity. In this scenario, the CE is shown as a model upon which the construction sector can rely to achieve its environmental impact reduction objectives.
A new paradigm guarantees the maximum use of resources and their biodegradability. The consideration of resources and technological nutrients leads us to consider the outputs of production processes as future inputs in other processes. The ideas of reducing, reusing and recycling are the basis of the new productive systems. Their application will translate into future sustainability. Moreover, public administrations, companies and institutions that seek sustainability have the right to ask companies to build their facilities in a manner that applies the CE in their processes. The problem is that there is no scale that allows us to measure the degree to which the CE is implemented.
To resolve this issue, a scale of desirable indicators of the company’s circularity thinking was prepared. However, the application of life cycle theory to the building sector allows establishing 5 phases in which circularity thinking of the company is considered: the design phase, the manufacture of materials phase, the construction process phase, the maintenance phase, and the end-of-life phase. From practical point of view, it is easier to minimize the environmental impact in a systematic manner. In addition, it is useful to establish the level of the decisions, distinguishing between the organizational level, processes, and workgroup. Measuring the degree of the implementation of CE in each phase, the companies can be ranked, allowing businesses and administrations to evaluate the sustainability and create more effective strategies.
After the design of the scales, a Monte Carlo simulation method was used to evaluate the reliability of the CE measure. The results indicate that this scale will be useful to assess and evaluate each building project’s environmental impact. The results show the relevance of each indicator and the desirable target, keeping in mind both each phase and each level.
First, the design phase indicators as design thinking on deconstruction strategies are a key indicator, with 100% being a desirable value (at the organizational level); in addition, the scale uses indicators related to design based on the full BIM (Building Information Modelling) standard (at the process level), 100% being the desirable value; indicators of ‘Closed loop’ instruction for designer (at the workgroup level) are also relevant; the desired value of this group would be 70% of fulfilment.
Second, in the phase of material manufacturing, the initiatives for sustainable production are a key indicator of the CE at the organizational level, and the desirable value is 80%. Moreover, continual improvement in the application of the CE at the process level is relevant, requiring a value of 90%. Focusing on the workgroup level, the indicator uses more sustainable sources, reuses components, recycles, and applies 3R (Reduce-Reuse-Recycle) ideas to the process; its target is 100%.
Third, in the phase of the construction process, focusing on the organizational level, it is desirable for the indicator energy use intensity to show a value of 90%, whereas at the process level, a percentage of construction site waste generated must be established, with a value target for this item of 100% of fulfilment. However, at the workgroup level, we need to measure the level of waste and components recollected for reuse and recycling by applying 3R principles. The target for this indicator is 40%.
Fourth, in the phase of building maintenance, analysed at the organizational level, the management of building strategies is a key indicator with a value of 80%; processes based on BIM at the process level have an expected value of 80%, and instructions based on CE and BIM at the workgroup level have a desirable value of 90%.
Finally, the phase ‘end of life’ includes, at the organizational level, the indicator decision accuracy of demolition time and transition to another loop, with an expected value of 70%; the decision accuracy of demolition methods regarding the process level has an expected value of 90%, and the indicator of the decision accuracy of demolition techniques at the workgroup level has an expected value of 90%.
Conclusion
Based on the results, the paper contributes to develop the transition of the linear model to the circular model. Low scale values imply building companies working in the linear model, whereas high values of the final score for the CE show that companies make a commitment to implementing this model. Therefore, this paper’s primary contribution lies in designing a scale of measurement of the degree of CE implementation, which will be useful for both government and businesses by facilitating the transition to the CE. Besides, a use of Monte Carlo simulations to rate construction enterprises in terms of their propensity to conduct activities based on the CE concept is an innovative solution. This may be treated as another contribution of the paper..
Limitations and Future Research Line
This paper has the limitations derived from the use of a simulation method. It could be solved through a quantitative study using a Confirmatory Factor Analysis, which allows establishing the statistical properties of the scale. Another limitation originates in the horizontal nature of the research. The indicators are gathered at one point in time. It would be worthwhile analysing the circularity from an evolutionary perspective. Such an approach would use extended periods to isolate temporal phenomena that could distort the outcome. The limitations and the depth of the study have led to a series of future research proposals that are set out below. It is believed that it would be interesting to design a scale, not for a specific moment in time, but over a broader period of time and using longitudinal analysis to observe the evolution of the indicators.
(adsbygoogle = window.adsbygoogle || []).push({});
References
- Arnold, U. and Yildiz, Ö. (2015) ‘Economic risk analysis of decentralized renewable energy infrastructures – A Monte Carlo Simulation approach’, Renewable Energy, 77, pp. 227–239. doi: 10.1016/j.renene.2014.11.059.
- Bauer, J. W. and Dolan, E. M. (2011) Rural Families and Work : Context and Problems. Edited by J. W. Bauer and E. M. Dolan. Springer-Verlag New York (International Series on Consumer Science). doi: 10.1007/978-1-4614-0382-1
- Boons, F., Chertow, M., Park, J., Spekkink, W. and Shi, H. (2017) ‘Industrial Symbiosis Dynamics and the Problem of Equivalence: Proposal for a Comparative Framework’, Journal of Industrial Ecology, 21(4), pp. 938–952. doi: 10.1111/jiec.12468.
- Braungart, M., McDonough, W. and Bollinger, A. (2007) ‘Cradle-to-cradle design: creating healthy emissions – a strategy for eco-effective product and system design’, Journal of Cleaner Production, 15(13–14), pp. 1337–1348. doi: 10.1016/j.jclepro.2006.08.003.
- Bronfenbrenner, U. (1979) The ecology of human development: Experiments by design and nature, Harvard University Press.
- Bubolz, M. M. and Sontag, M. S. (1993) ‘Human Ecology Theory’, in Sourcebook of Family Theories and Methods: A Contextual Approach, pp. 419–448.
- Van Dijk, S., Tenpierik, M. and Van Den Dobbelsteen, A. (2014) ‘Continuing the building’s cycles: A literature review and analysis of current systems theories in comparison with the theory of Cradle to Cradle’, Resources, Conservation and Recycling, pp. 21–34. doi: 10.1016/j.resconrec.2013.10.007.
- Dutra, C. C., Ribeiro, J. L. D. and de Carvalho, M. M. (2014) ‘An economic–probabilistic model for project selection and prioritization’, International Journal of Project Management, 32(6), pp. 1042–1055. doi: 10.1016/j.ijproman.2013.12.004.
- Ehrenfeld, J. R. (1997) ‘The Importance of LCAs—Warts and All – Ehrenfeld – 2008 – Journal of Industrial Ecology – Wiley Online Library’, Journal of Industrial Ecology, 1(2), pp. 41–49. doi: 10.1162/jiec.1997.1.2.41.
- Esa, M. R., Halog, A. and Rigamonti, L. (2017) ‘Developing strategies for managing construction and demolition wastes in Malaysia based on the concept of circular economy’, Journal of Material Cycles and Waste Management, 19(3), pp. 1144–1154. doi: 10.1007/s10163-016-0516-x.
- González Dan, J. R., Guix, A., Martí, V., Arnaldos, J. and Darbra, R. M. (2016) ‘Monte Carlo simulation as a tool to show the influence of the human factor into the quantitative risk assessment’, Process Safety and Environmental Protection, 102, pp. 441–449. doi: 10.1016/j.psep.2016.04.024.
- Hao, Q., Tian, J., Li, X. and Chen, L. (2017) ‘Using a hybrid of green chemistry and industrial ecology to make chemical production greener’, Resources, Conservation and Recycling, 122, pp. 106–113. doi: 10.1016/j.resconrec.2017.02.001.
- Jiménez Rivero, A., Sathre, R. and García Navarro, J. (2016) ‘Life cycle energy and material flow implications of gypsum plasterboard recycling in the European Union’, Resources, Conservation and Recycling, 108, pp. 171–181. doi: 10.1016/j.resconrec.2016.01.014.
- Kibert, C. J. (2007) ‘The next generation of sustainable construction’, Building Research and Information, pp. 595–601. doi: 10.1080/09613210701467040.
- Lenox, M. and Ehrenfeld, J. (1997) ‘Organizing for effective environmental design.’, Business Strategy & the Environment (John Wiley & Sons, Inc). John Wiley & Sons, Inc., 6(4), pp. 187–196.
- Lewandowski, M. (2016) ‘Designing the business models for circular economy-towards the conceptual framework’, Sustainability (Switzerland). doi: 10.3390/su8010043.
- Lihong, W. and Hui, Z. (2011) ‘Development of circular economy and optimization of industrial structure for Shandong Province’, Energy Procedia, 5, pp. 1603–1610. doi: 10.1016/j.egypro.2011.03.273.
- Mangla, S. K., Kumar, P. and Barua, M. K. (2014) ‘Monte Carlo Simulation Based Approach to Manage Risks in Operational Networks in Green Supply Chain’, Procedia Engineering, 97, pp. 2186–2194. doi: 10.1016/j.proeng.2014.12.462.
- McDonough, W., Braungart, M., Anastas, P. T. and Zimmerman, J. B. (2003) ‘Peer Reviewed: Applying the Principles of Green Engineering to Cradle-to-Cradle Design’, Environmental Science & Technology, 37(23), p. 434A–441A. doi: 10.1021/es0326322.
- Mulhall, D. and Braungart, M. (2010) ‘Cradle to Cradle for the built environment’, Ekonomiaz No. 75, (4), pp. 182–193. Available at: https://ideas.repec.org/a/ekz/ekonoz/2010415.html.
- Nasir, M. H. A., Genovese, A., Acquaye, A. A., Koh, S. C. L. and Yamoah, F. (2017) ‘Comparing linear and circular supply chains: A case study from the construction industry’, International Journal of Production Economics, 183, pp. 443–457. doi: 10.1016/j.ijpe.2016.06.008.
- Núñez-Cacho, P., Grande, F. A. and Pedrosa, C. (2012) ‘The challenge of human resource management for the family business: state of the question’, El reto de la dirección de recursos humanos para las empresas familiares: estado de la cuestión, 8(23), pp. 139–162.
- Olaru, M., Şandru, M. and Pirnea, I. C. (2014) ‘Monte Carlo Method Application for Environmental Risks Impact Assessment in Investment Projects’, Procedia – Social and Behavioral Sciences, 109, pp. 940–943. doi: 10.1016/j.sbspro.2013.12.568.
- Pask, F., Lake, P., Yang, A., Tokos, H. and Sadhukhan, J. (2017) ‘Sustainability indicators for industrial ovens and assessment using Fuzzy set theory and Monte Carlo simulation’, Journal of Cleaner Production, 140, pp. 1217–1225. doi: 10.1016/j.jclepro.2016.10.038.
- Lo Presti, D. (2013) ‘Recycled Tyre Rubber Modified Bitumens for road asphalt mixtures: A literature review’, Construction and Building Materials, 49, pp. 863–881. doi: 10.1016/j.conbuildmat.2013.09.007.
- Rousseau, D. M., Manning, J. and Denyer, D. (2008) ‘Evidence in management and organizational science: Assembling the field’s full wieght of scientific knowledge through synthesis’, The Academy of Management Annals, 2(1), pp. 475–515.
- Shadram, F., Johansson, T. D., Lu, W., Schade, J. and Olofsson, T. (2016) ‘An integrated BIM-based framework for minimizing embodied energy during building design’, Energy and Buildings, 128, pp. 592–604. doi: 10.1016/j.enbuild.2016.07.007.
- Silvestre, J. D., De Brito, J. and Pinheiro, M. D. (2014) ‘Environmental impacts and benefits of the end-of-life of building materials – Calculation rules, results and contribution to a “cradle to cradle” life cycle’, Journal of Cleaner Production, 66, pp. 37–45. doi: 10.1016/j.jclepro.2013.10.028.
- Tate, E. (2012) ‘Social vulnerability indices: A comparative assessment using uncertainty and sensitivity analysis’, Natural Hazards, 63(2), pp. 325–347. doi: 10.1007/s11069-012-0152-2.
- Tibbs, H. (1993) Industrial ecology: an environmental agenda for industry. Global Business Network.
- Tranfield, D., Denyer, D. and Smart, P. (2003) ‘Towards a Methodology for Developing Evidence-Informed Management Knowledge by Means of Systematic Review’, British Journal of Management, 14(3), pp. 207–222. doi: 10.1111/1467-8551.00375.
- Vázquez, R. and López, E. (2011) ‘Responsabilidad social corporativa: una revisión sistemática de la literatura’, in Comunicación a las II Jornadas pymes, empresa familiar e iniciativa emprendedora. Universidad Pablo Olavide.
- Wadel, G., Avellaneda, J. and Cuchí, A. (2010) ‘La sostenibilidad en la arquitectura industrializada: cerrando el ciclo de los materiales’, Informes de la Construcción, 62(517), pp. 37–51. doi: 10.3989/ic.09.067.
- Winston, W. L. (2008) Investigación de operaciones. Grupo Editorial Iberoamericano. México.
- Zio, E. (2013) The Monte Carlo Simulation Method for System Reliability and Risk Analysis. London: Springer (Springer Series in Reliability Engineering).


